1. Summary
Diffusion Properties of Calmodulin, CaMKII, and RC3 Andrew Harrell, Hugo Sanabria, Neal Waxham Department of Neurobiology and Anatomy, University of Texas Medical School, Houston, TX. 1. Summary

1. Summary
E N D
Presentation Transcript
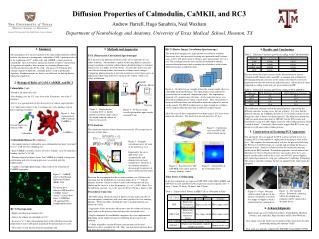
Diffusion Properties of Calmodulin, CaMKII, and RC3 Andrew Harrell, Hugo Sanabria, Neal Waxham Department of Neurobiology and Anatomy, University of Texas Medical School, Houston, TX • 1. Summary • My main project was an investigation of the intracellular diffusion of RC3 protein, also known as neurogranin, calmodulin (CaM), a protein involved in the regulation of Ca2+ within cells, and CaMKII, a target protein of calmodulin. Also, I devoted a significant amount of time to constructing an apparatus designed to drive mirrors in a scanning Fluorescence Correlation Spectroscopy (FCS) setup. Our goal is to determine how cellular controls of diffusion, a random process, lead to predictable signaling. Random motion, we find, is not sufficient for driving known biochemical pathways. • 2. Biological Roles of CaM, CaMKII, and RC3 • Calmodulin Kinase II (CaMKII-α) • One target protein of calmodulin, once caldmodulin has been “activated“ by Ca2+ at all four of its binding sites • Each CaMKII-α actually consists of twelve subunits, each of which has a binding site for Ca2+/CaM. • Pharmacological evidence shows that CaMKII-α is linked to long term potentiation and active learning processes associated with the hippocampus. • Capable of autophosphorylating, which leads to the formation of CaMKII aggregates. • RC3 (Neurogranin) • Highly enriched in pyramidal cells. • Affects the affinity of calmodulin to Ca2+. • Increases Ca2+’s rate of dissociation from CaM, which increases the proportion of time CaM spends in partially bound and inactive states. • This is RC3’s only known function regarding CaM. 4. Results and Conclusions 3. Methods and Apparatus FCS (Fluorescent Correlation Spectroscopy) FCS measures the diffusion of fluorescently active molecules in very dilute solutions. The method is capable of detecting diffusive particles using two-photon excitation (which reduces photobleaching) to stimulate fluorescence in a highly focused volume. As molecules move into and out of the excitation volume, the intensity of fluorescence changes. Comparing photon intensity at one time to intensity at later times gives an indication of how long molecules remain in the volume, which is an effect of diffusion. RICS (Raster Image Correlation Spectroscopy) Table 2 – Diffusion Constants (μm2/s) According to the Cube Root Rule This method of imaging uses single photon excitation to stimulate fluorescent dyes, but instead of focusing on a particular small volume, scans a 256 x 256 pixel region to obtain a more macroscopic view of a cell. The resulting intensity data can then be modeled to another autocorrelation function which considers the relatedness of data from different locations at different times. Here are shown the relative masses of the three proteins of interest (*bound to GFP chimerically) and GFP. A common rule of thumb for determining diffusion constants in free media states that D is inversely proportional to the cube root of the molecular mass. All theoretical values, computed according to this rule, are given relative to GFP. Sample Pulse Laser Dichroic Mirror • Calmodulin(CaM) • Found in all eukaryotic cells • Four binding sties for Ca2+ ions (two at the N-terminus, two at the C-terminus) • Serves as a signal protein to alter the activity of various target proteins • Ca2+ binds most slowly to the C-terminus sites (rate-limiting steps in many signaling reactions). Figure 6 – On the left is an example of how the scanner might observe a calmodulin molecule diffusing. The spatial data is then repeated to generate data for a temporal comparison (right). Our experiments repeated 3.93s spatial scans 100 times. As the molecule moves, it is detected in multiple pixels within a single frame. Thus, the position is known at different times, and information about the molecule’s motion can be gained. The RICS method covers a large enough area within a cell to compare diffusion constants in different cellular regions. Table 3 – Diffusion Constants (μm2/s) According to FCS and RICS Figure 3 – Single photon excitation (left) vs. double photon excitation (right); notice the highly reduced volume of fluorescent activity. Figure 4 – FCS laser setup; wavelength incident upon sample around 850 nm. Detector Figure 1 – Size comparison of GFP-CaM and CaMKII-α These diffusion constants follow the general pattern expected by the diffusion constants in some cases, but not in others. It is clear that the diffusion constant for CaMKII is the lowest, as was projected due to size, though the value is lower even than expected. The diffusion constant for CaM was much lower than that for GFP-RC3 in the FCS results only. Possibly this is due to CaM’s higher reactivity with cellular proteins, which “weight it down.” Conversely, these results suggest that RC3 is not very interactive with many other cellular proteins. All of the scans in these experiments were done using a 63x Zeiss water immersion objective. The dwell time on each pixel was 25.6 μs. Green Fluorescent Protein (GFP) FCS Analysis: CaMKII-α Calmodulin Figure 7 – Correlation curve for GFP-CaM with residuals on top. The correlation function relates fluorescent intensity (F(t))at one time to intensity at later times. Figure 5 – Example correlation curves for each of the proteins in vivo. Importantly, the curve approaches zero asymptotically and demonstrates no large irregularities. Intensity at one moment correlates decreasingly to intensity at times further into the future. 5. Construction of Scanning FCS Apparatus One goal of the lab is to upgrade the FCS system currently in use to a scanning FCS system capable of single particle tracking in vitro and in vivo . This requires the construction of a device for precisely deflecting the FCS laser to different parts of a sample and recording the data as a function of time. Analysis is done based on the correlation function similar to the RICS method. To build the apparatus, the lab ordered two Micromax 671 Series Dual Axis Drivers (one card to drive the x-axis mirror, and the other card for the y-axis), two 18V DC power supplies, and a mirror/galvanometer setup, pre-calibrated at Cambridge Technology. The setup is currently working, but not yet adapted to the output from the computer. Figure 8 – Raw Data for CaM-GFP HEK Cell (colors indicate average intensity values) Figure 9 – Contour Plot of the Correlation Curve Based on the assumption that the excitation volume is a 3-D Gaussian (meaning that the probability of excitation drops off as e-αx2with the distance from the volume’s center) it can be shown that the half-max, labeled on the curve as τD has the property: τD = (ω2xy)/(8D), where D is the diffusion constant. ωxy is the waist of the laser beam, a known value. Figure 2 – CaMKII expressed in Human Embryonic Kidney (HEK) Cells The green glow indicates GFP bound to CaMKII. Small “beads” of color show where CaMKII has self-aggregated by autophosphorylation. Time Series Cell Imaging In the last experiment, we expressed GFP, GFP-CaM, GFP-CaMKII, and GFP-RC3 in cells and observed the expression macroscopically after 4 hours, 7 hours, 24 hours, 28 hours, and 47 hours. Procedural Concerns: Table 1 – Expression of Protein in HEK Cells as a Function of Time • - Photobleaching, the inactivation of fluorescent dye molecules due to electromagnetic stimulation, will cause some particles to cease emitting photons. While inevitable, limiting the laser’s incident intensity can reduce this effect. • Aggregates of dye molecules which move into the volume of interest cause spikes in the intensity data and skew the correlation curve. • Single component fits and double component fits were implemented, depending on the number of species exhibiting fluorescence in the solution. • Cellular organelles contain different concentrations of dye and themselves move around in the cell. They can also distort intensity data and skew the correlation curve. Figure 11 – The finished device. Eventually, a housing will be developed and a computer will be connected as the input device. Figure 10 – Oops! We had a small accident with one of the mirrors; fortunately, CamTech was happy to supply us with a replacement for a nominal fee. 6. Acknowledgments Many thanks go to my fellow lab workers, Yoshi Kubota, Matthew Swulius, and ,especially, Hugo Sanabria and Dr. Neal Waxham. Also, thank you to the Gulf Coast Consortia at Rice University for their sponsorship during this summer’s REU. This work was partially supported by NSF REU Grant DMS-0755294.