Download
1 / 194
1.94k likes | 2.09k Vues
Hickory and Triad PM2.5 SIP Development Stakeholder Meeting. Presented By: NC Division Of Air Quality Attainment Planning Branch Hosted At: P iedmont A uthority for R egional T ransportation Offices November 14, 2007. Meeting Outline. Fine Particulate Matter Background

E N D
Hickory and TriadPM2.5 SIP Development Stakeholder Meeting Presented By: NC Division Of Air Quality Attainment Planning Branch Hosted At: PiedmontAuthorityforRegionalTransportationOffices November 14, 2007
Meeting Outline • Fine Particulate Matter Background • Air Quality Modeling Overview • Emissions Inventory Development • Model Performance • Attainment Test • General Insignificance of PM2.5 Species • Clean Air Act Requirements • Motor Vehicle Emissions Budgets • Summarize / Next Steps
Fine Particulate Matter BackgroundAir Quality Modeling OverviewEmissions Inventory Development George Bridgers, NCDAQ Meteorologist II Acting Chief of Attainment Planning
PM2.5 (2.5 µm) PM10 (10µm) Particulate Matter: What is It? A complex mixture of extremely small particles and liquid droplets Hair cross section (70 mm) Human Hair (70 µm diameter) M. Lipsett, California Office of Environmental Health Hazard Assessment
Public Health Risks Are Significant Particles are linked to: • Premature death from heart and lung disease • Aggravation of heart and lung diseases • Hospital admissions • Doctor and ER visits • Medication use • School and work absences • And possibly to • Lung cancer deaths • Infant mortality • Developmental problems in children, such as low birth weight
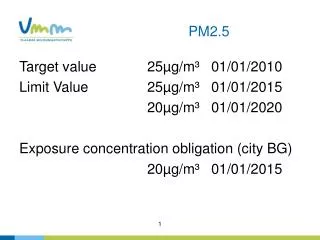
National Ambient Air Quality Standard (NAAQS) • Annual PM2.5 NAAQS • A monitor is violating the annual standard, if the annual design value is > 15.0 µg/m3 • The annual design value is defined as: • Annual mean concentration averaged over 3 years • Daily PM2.5 NAAQS • A monitor is violating the daily standard, if the daily design value is > 35 µg/m3 • The daily design value is defined as: • Annual 98th percentile concentrations averaged over 3 years
North Carolina Areas Designated Nonattainment for PM2.5 2001 – 2003 Design Value Catawba – 15.5µg/m3 Davidson – 15.8µg/m3 Guilford – 14.0 µg/m3
PM2.5 Nonattainment Timeline Effective date = SIP submittal date = Attainment date = Data used to determineattainment = (Modeling) Attainment year = Maintenance years = April 5, 2005 April 5, 2008 April 5, 2010* 2007-2009 2009 TBD * Or as early as possible
VISTAS / ASIP • Visibility Improvement State and Tribal Association of the Southeast • Association of Southeastern Integrated Planning • Collaborative effort of States and Tribes to support management of regional haze, and attainment demonstrations for fine particulate matter and ozone nonattainment areas in the Southeastern US • No independent regulatory authority and no authority to direct or establish State or Tribal law or policy.
NC / SC SIP Coordination • Working together in VISTAS / ASIP • Making use of VISTAS 2002 meteorological, emissions and air quality modeling • Future year (2009) work completed through ASIP • Control strategies for the Metrolina area developed through a consultation process involving NCDAQ, SCDHEC and appropriate stakeholders
SparseMatrixOperatorKernelEmissions Emissions Processor Meteorological Model SMOKE MM5 Community Multiscale Air Quality System Air Quality Model CMAQ Temporally and Spatially Gridded Air Quality Output predictions Air Quality Modeling System
Model Selection • Meteorological Model • Mesoscale Meteorological Model (MM5) • Emissions Model • Sparse Matrix Operator Kernel Emissions (SMOKE) • Air Quality Model • Community Multiscale Air Quality (CMAQ) model
Modeling Season / Episode • Full Year of 2002 selected for VISTAS / ASIP modeling • Regional Haze / Fine Particulate: Full Year • The “higher” portion of the 2002 ozone season selected for the Attainment Demonstration modeling • No exceedances in April or October • Used modeling for May through September
Gridding Speciation Temporal SMOKE Emission Model Emission Inventory Emission Processing
Emission Source Categories • Point sources: utilities, refineries, industrial sources, etc. • Area sources: gas stations, dry cleaners, farming practices, fires, etc. • On-road mobile sources: cars, trucks, buses, etc. • Nonroad mobile sources: agricultural equipment, recreational marine, lawn mowers, construction equipment, etc. • Biogenic: trees, vegetation, crops
Emissions Inventory Definitions • Actual = the emissions inventory developed to simulate what happened in 2002 • Used for model performance evaluation only. • Typical = the emissions inventory developed to characterize the “current” emissions… It does not include specific events, but rather averages or typical conditions • Only effects emissions from electric generating units and forest management/wild fires • Future = the emissions inventory developed to simulate the attainment year 2009
VISTAS / ASIP Actual 2002 Inventory • Utilized Consolidated Emissions Reporting Rule (CERR) submittals for calendar year 2002 • Point, Area and select Nonroad mobile sources • Augment State data where pollutants missing • Generate large forest management/wild fires as specific daily events • Utility Emissions refined using actual Continuous Emissions Monitor (CEM) distributions • On-road mobile processed through MOBILE6 module of SMOKE emissions system • Majority of Nonroad mobile emissions estimated using NONROAD2005c model • Biogenic emissions estimated with BEIS3 model
VISTAS / ASIP Typical 2002 Inventory • Nonroad Mobile, On-road Mobile & Biogenic Sources • Same as Actual 2002 Inventory • Area Sources • Only forest management/wild fires changed • Worked with Forest Service to develop typical fire inventory • Point Sources • Only utility emissions changed • Used 2000 – 2004 average heat input from CEM data to adjust 2002 emissions
VISTAS / ASIP Typical 2009 Inventory • Nonroad Mobile Sources • Re-ran NONROAD2005c model for 2009 • Grew aircraft, locomotive and commercial marine engine emissions • On-road Mobile Sources • Re-ran MOBILE module in SMOKE for 2009 • Used transportation partners speed, vehicle miles traveled, etc • Area Sources • Grew all sources except forest management/wild fire emissions • Forest management/wild fire typical emissions kept constant • Point Sources • Grew all sources except utility emissions • Ran Integrated Planning Model (IPM) for projected utility emissions • Biogenic – same as 2002 emissions
Controls Applied • NOx SIP Call • Seasonal NOx emission caps large industrial boilers • Clean Smokestacks Act • Effects North Carolina Duke Energy & Progress Energy sources • Year-round caps of NOx (2007 & 2009) andSO2 (2009 & 2013) • No trading allowed to meet caps • Required to submit compliance plan annually • Clean Air Interstate Rule (CAIR) • Year-round NOx (2009 & 2015) and SO2 (2010 & 2015) caps for utilities • Allows for trading credits
Controls Applied (continued) • Vehicle emissions testing • Expanded from 9 to 48 Counties; • All of the North Carolina Metrolina counties have I/M program • Ultra-Low sulfur fuels • Both diesel and gasoline • Cleaner engines • Tier 2 vehicle standards • Heavy duty gasoline & diesel highway vehicle standards • Large nonroad diesel engine standards • Nonroad spark engine & recreational engine standards
Model Performance Evaluation Nick Witcraft, NCDAQ Meteorologist I
Meteorological Modeling • Penn State / NCAR MM5 meso-scale meteorological model • Version 3.6.1+ • Widely used in theresearch and regulatorycommunities • VISTAS Contracted WithBarons AdvancedMeteorological Systems(BAMS) • Run at both 36km (Nationwide)and 12km (Southeastern US) resolutions for 2002
Modeling Domains 12 km 36 km
Grid Structure Vertical: MM5 = 34 layers SMOKE & CMAQ = 19 layers ~48,000 ft Horizontal: 36 km & 12 km Layer 1 = 36 m deep Ground
Met Model Performance • Model Performance For Key Variables: • Temperature • Moisture (Mixing Ratio & Relative Humidity) • Winds • Precipitation • Summary Of Met Model Performance
Temperature • Overall diurnal pattern captured very well • Slight cool bias in the daytime • Slight warm bias overnight
Temperature • Little bias in summer, low bias in winter • Lower error in summer, greater error in winter
Moisture (Mixing Ratio) • Tracks observed trends fairly well • Low bias in the morning through the early afternoon • High bias in the late afternoon and at night
Moisture (Mixing Ratio) • Negligible bias most of year; lowest in Sep/Oct • Higher error in summer
Moisture (Relative Humidity) • High bias in the daytime • Low bias at night RH is linked to temperature and moisture biases
Moisture (Relative Humidity) • Slight high bias most of year • Low bias Sep-Nov RH is linked to temperature and moisture biases
Wind Speed • ~1 mph high bias day, ~2 mph high bias at night • Partly due to relative inability of winds in the model to go calm (There is always “some” wind) • Also due to “starting thresholds” of observation network… network can’t measure winds < 3 mph, so winds < 3 mph are reported as “calm”
Wind Speed • Improved performance when factoring out calm winds • Bias and error fairly steady throughout the year
Observed Precip January Modeled Precip January Observed Precip April Modeled Precip April
Observed Precip JULY Modeled Precip JULY Observed Precip October Modeled Precip October
Model Performance StatisticsMeteorology In North Carolina Quarterly Meteorological Statistics
Met Model Performance • Model Performance For Key Variables: • Temperature • Moisture (Mixing Ratio & Relative Humidity) • Winds • Precipitation • Summary Of Met Model Performance