Download
1 / 1
10 likes | 128 Vues
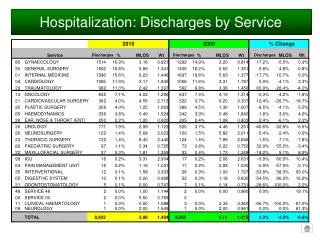
This report presents the discharge statistics across various medical services for the years 2010 and 2009. It highlights the percentage of discharges, average length of stay (MLOS), and percentage changes in service utilization over this period. Significant observations include trends in gynaecology, general surgery, internal medicine, and more, indicating areas of growth or decline. The data can serve as a valuable resource for healthcare professionals and administrators to analyze service performance and patient care trends.

E N D
Service Discharges % MLOS Wt Discharges % MLOS Wt Discharges MLOS Wt 85 GYNAECOLOGY 1514 16.9% 3.18 0.821 1292 14.9% 3.20 0.814 17.2% -0.5% 0.9% 20 GENERAL SURGERY 1502 16.8% 5.89 1.341 1406 16.2% 5.62 1.351 6.8% 4.8% -0.8% 01 INTERNAL MEDICINE 1396 15.6% 6.23 1.446 1697 19.6% 5.63 1.377 -17.7% 10.7% 5.0% 04 CARDIOLOGY 1065 11.9% 3.17 1.845 1006 11.6% 3.31 1.787 5.9% -4.1% 3.3% 29 TRAUMATOLOGY 982 11.0% 2.42 1.397 592 6.8% 3.38 1.456 65.9% -28.4% -4.0% 13 ONCOLOGY 635 7.1% 4.02 1.290 637 7.4% 4.19 1.314 -0.3% -4.2% -1.9% 21 CARDIOVASCULAR SURGERY 362 4.0% 4.55 2.713 322 3.7% 6.20 3.337 12.4% -26.7% -18.7% 25 PLASTIC SURGERY 356 4.0% 1.25 1.063 389 4.5% 1.30 1.007 -8.5% -4.1% 5.5% 65 HAEMODYNAMICS 336 3.8% 0.49 1.924 342 3.9% 0.48 1.840 -1.8% 3.0% 4.6% 28 EAR, NOSE & THROAT (ENT) 200 2.2% 1.20 0.820 205 2.4% 1.28 0.803 -2.4% -6.1% 2.2% 30 UROLOGY 171 1.9% 2.99 1.123 320 3.7% 4.46 1.201 -46.6% -32.8% -6.5% 26 NEUROSURGERY 122 1.4% 5.68 2.023 129 1.5% 5.82 2.011 -5.4% -2.4% 0.6% 23 THORACIC SURGERY 122 1.4% 8.40 2.440 124 1.4% 7.85 2.646 -1.6% 7.1% -7.8% 82 PAEDIATRIC SURGERY 97 1.1% 0.34 0.725 73 Hospitalization: Discharges by Service 2010 2009 % Change 0.8% 0.22 0.750 32.9% 55.2% -3.4% 22 MAXILLOFACIAL SURGERY 27 0.3% 1.81 1.359 33 0.4% 1.73 1.248 -18.2% 5.1% 8.9% 99 ICU 16 0.2% 3.31 2.904 17 0.2% 2.06 2.631 -5.9% 60.9% 10.4% 64 PAIN MANAGEMENT UNIT 16 0.2% 1.19 1.031 17 0.2% 2.82 1.030 -5.9% -57.9% 0.1% 35 INTERVENTIONAL 12 0.1% 1.58 3.333 26 0.3% 1.00 1.727 -53.8% 58.3% 93.0% 05 DIGESTIVE SYSTEM 10 0.1% 2.20 0.968 22 0.3% 1.18 0.830 -54.5% 86.2% 16.6% 31 ODONTOSTOMATOLOGY 5 0.1% 0.00 0.747 7 0.1% 0.14 0.731 -28.6% -100.0% 2.2% 48 SERVICE 48 2 0.0% 1.00 1.144 2 0.0% 0.00 0.960 0.0% 19.1% 00 SERVICE 00 2 0.0% 5.50 0.765 0 11 CLINICAL HAEMATOLOGY 1 0.0% 0.00 1.088 3 0.0% 2.33 3.360 -66.7% -100.0% -67.6% 09 NEUROLOGY 1 0.0% 2.00 1.549 1 0.0% 2.00 0.961 0.0% 0.0% 61.3% TOTAL 8,952 3.98 1.404 8,663 4.14 1.415 3.3% -4.0% -0.8%