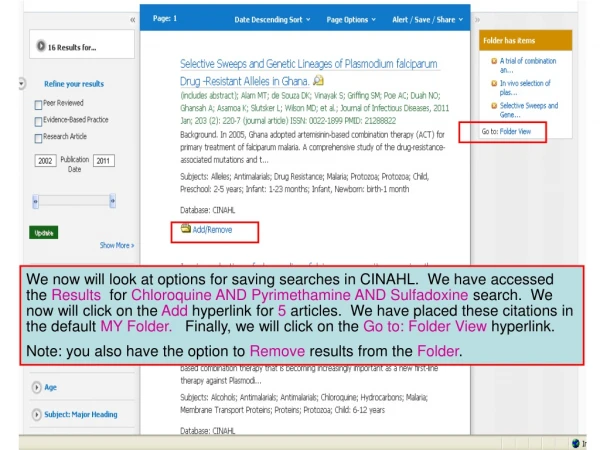
IPMI Email Alert Example: Chassis Intrusion Detection and Sensor Monitoring
This document provides an example of an IPMI email alert concerning chassis intrusion detection. It details the system's IP address (192.168.1.34) and GUID (02.30.48.ff.fe.d9.7a.fe.08.09.0a.0b.0c.0d.0e.0f), along with sensor type and event type data. The specific parameters include sensor numbers, readings, and classifications of events, such as temperature, voltage, and RPM for various components. Threshold descriptions clarify the significance of the readings. For more information, refer to the provided slides detailing sensor types and event mappings.

IPMI Email Alert Example: Chassis Intrusion Detection and Sensor Monitoring
E N D
Presentation Transcript
Email Alert Example • PEF EMail alert • System IP: 192.168.1.34 • System GUID: 02 30 48 ff fe d9 7a fe 08 09 0a 0b 0c 0d 0e 0f • Sensor Type: 05 • Sensor No.: 44 • Event Type: 6f • Data: 00 00 00 For more information, refer to slide-3 For more information, refer to slide-4 For more information, refer to slide-5 For more information, refer to slide-7 Slides: 34567
Sensor Type • 01: Temperature • 02: Voltage • 03: Current • 04: Fan • 05: Chassis Intrusion • 06: Platform Security Breach • 07: Processor • 08: Power Supply • 09: Power Unit • 0A: Cooling Device • 0C: Memory • 0D: Drive Slot • 0F: POST Error Slides: 24567
Sensor Number Sensor Type Sensor # CPU1 Temp 00h CPU2 Temp 01h Sys Temp 02h Temperature = DataCPU1 Vcore 03h Voltage = Data* 0.008 CPU2 Vcore 04h Voltage = Data* 0.0083.3V 05h Voltage = Data* 0.0165V 06h Voltage = Data* 0.02412V 07h Voltage = Data* 0.096-12V 08h Voltage = Data*0.148 - 16.921.5V 09h Voltage = Data* 0.0165VSB 0Ah Voltage = Data* 0.024VBAT 0Bh Voltage = Data* 0.016Fan1 0Ch RPM = 1350000/DataFan2 0Dh RPM = 1350000/DataFan3 0Eh RPM = 1350000/DataFan4 0Fh RPM = 1350000/DataFan5 10h RPM = 1350000/DataFan6 11h RPM = 1350000/DataFan7/CPU1 12h RPM = 1350000/DataFan8/CPU2 13h RPM = 1350000/DataIntrusion 44hPower Supply 14h Data: is the second value in the data field Example: 54 00 02. 00 is the data field here. Slides: 23567
Event Type Slides: 23467
Data Field Slides: 23457
Threshold Description Here are the several conditions, • Higher Non-Recoverable • Higher Critical • Higher Non-Critical • Normal • Lower Non-Critical • Lower Critical • Lower Non-Recoverable So, if it is lower critical going low then the reading is lower than lower critical but higher than Lower Non-Recoverable. Simply put, it is between Lower Critical and Lower Non-recoverable. Slides: 234568
Data Field Here is what data 1 and data 3 means. For both the data-fields, we consider only the last 4 bits (bit 0~3). Data-1: Let us consider the following email alert as an example, Sensor Type: 04 Sensor No.: 0d Event Type: 01 Data: 54 00 02 Here we see 0x54 in the data-field 1. Since we consider only the last 4 bits, which in this case is 4. The value corresponds to “non-recoverable” when mapped using the table on slide-6. We have also seen 0x50, 0x52. In all the cases we consider only the last 4 bits, that is either 0 or 2. By mapping these values to the table on slide-6, we obtain 0-non-critical 2-critical Data-3 is the threshold value. We have our minimum RPM value set to 100. From this data we can find out the value that triggered the event. • For example: 54 00 02 that means, non-recoverable, 04 value (trigger value), and the threshold is 2 (200 rpm). The fan is triggered by non-recoverable value with threshold 200 rpm. Slides: 234567