SlideServe
Menu
Préférences
© SlideServe · v2026

Demographic Overview of Toronto East: Immigration and Community Composition

lynsey avatar
5 diapositives · 213 Views · Aug 15, 2014

This profile analyzes the demographics of Toronto East, focusing on areas such as Victoria Park Avenue, Broadview, East York, and Massey Creek. It reveals that 43.5% of the population resides in four key clusters, which together account for 52.5% of all immigrants in the region. Notably, one in seven individuals in these clusters is a newcomer, compared to one in twenty-two in the wider area. The report highlights the top immigrant origins: Southern Asia (61.9%), West Asia and the Middle East (9.7%), Southeast Asia (6.8%), Eastern Asia (6.8%), and Europe (5.9%).
Demographic Overview of Toronto East: Immigration and Community Composition - slide 1
01 / 5Demographic Overview of Toronto East: Immigration and Community Composition
1 / 17

Télécharger la présentation

Demographic Overview of Toronto East: Immigration and Community Composition
Une image / un lien ci-dessous est fourni (tel quel) pour télécharger la présentation

Politique de téléchargement : le contenu du site vous est fourni TEL QUEL pour votre information et votre usage personnel ; il ne peut être vendu, concédé sous licence ni partagé sur d’autres sites sans l’accord de son auteur.Le contenu vous est fourni TEL QUEL, pour votre information et votre usage personnel uniquement. Téléchargez la présentation en cliquant sur ce lien. Lors du téléchargement, si vous ne parvenez pas à télécharger une présentation, l’éditeur a peut-être supprimé le fichier de son serveur.Pendant le téléchargement, si vous ne parvenez pas à obtenir une présentation, le fichier a peut-être été supprimé par l’éditeur.

F I N

Plus de contenu associé

Transcription de la présentation
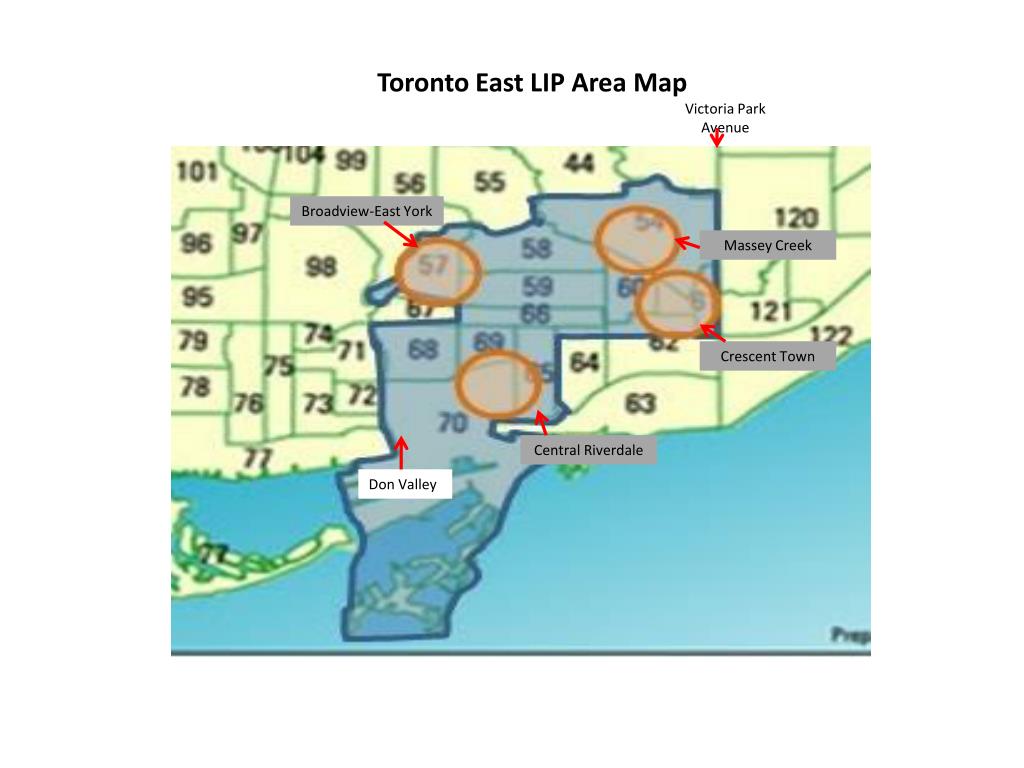
  1. Toronto East LIP Area Map Victoria Park Avenue Broadview-East York Massey Creek Crescent Town Central Riverdale Don Valley

  2. Toronto East Profile • Concentration • These four clusters represent 43.5 % of Toronto East Population yet 52.5 % of all • immigrants in the area. • Within these clusters one in every seven individuals is a newcomer, while in the rest of the • area the ratio is one in every twenty two.

  3. Distribution of all East Toronto residents, 2006 Distribution of all East Toronto immigrants, 2006 Distribution of all East Toronto newcomers, 2006

  4. Toronto East Comparison Top 10 Recent Immigrants (%)

  5. Neighbouring Communities of Oakridge and Clairlea-Birchmount (East Side of Crescent Town) • Top 5 Recent Immigrants: • Southern Asia (61.9 %) • West Asia & Middle East (9.7 %) • Southeast Asia (6.8%) • Eastern Asia (6.8%) • Europe (5.9 %)