Download
1 / 32
320 likes | 463 Vues
This lecture module presents an introduction to retrospective dosimetry through translocation analysis, highlighting the limitations of conventional assays like dicentric and cytokinesis-block micronucleus (CBMN) which suffer from unstable damage. It emphasizes the necessity of stable translocation analysis for estimating biodosimetry in long-term exposures. The application of FISH (Fluorescence In Situ Hybridization) techniques in visualizing translocations is detailed, alongside methods for estimating initial doses and assessing the persistence of aberrations over time, informed by data from past radiation accidents.

E N D
Retrospective DosimetrybyTranslocation Analysis Lecture Module 5
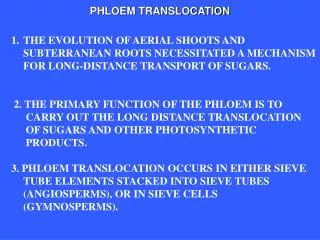
Introduction • Recognized drawback of dicentric and cytokinesis block micronucleus (CBMN) assays is that damage is unstable and therefore is eliminated from peripheral blood lymphocyte pool at rate that cell renewal occurs • It has long been recognized that analysis for more persistent types of damage, e.g. stable translocations, is needed to address biodosimetry for old or long term exposures • FISH techniques has made this possible
Approach before FISH • To calculate corrected dose taking into account the mean life of lymphocytes and exponential loss of cells with unstable aberrations • There are few data which enable reliable correction factor to be deduced • depending on factors such as infections, depression of aberration yield probably cannot be expressed simply as function of time alone • Nevertheless, an exponential disappearance rate with a half-time of about three years is accepted. As a general approximation this seems suitable when the sampling delay is long, say five or more years
Initialdose x exp(-0.693 x i/3). i = elapsed time in years Dose (Gy) years After 2 and 4 Gy irradiation: expected decrease in the estimated dose using dicentrics. This simulation considers an exponential disappearance rate of lymphocytes carrying unstable aberrations with a half-time of three years.
How valid is 3 years half life value? This seems to apply only to people with normal hematology. There is evidence that following high acute exposure reduction of dicentrics is biphasic: initially fast and then slower. Persistence of each phase seems to depend on initial frequency of aberrations Data from highly irradiated victims of the Chernobyl accident. Sevan’kaev et al., Radiat. Prot. Dosim. 113: 152-161 (2005)
Another approach is to consider the dilution with time of undamaged cells entering the circulation, and to estimate the initial dose using the method applied for partial irradiations. This is not feasible after long periods. This approximation gives realistic results only in some cases Data from highly irradiated victims of the Chernobyl accident. Sevan’kaev et al., Radiat. Prot. Dosim. 113: 152-161 (2005)
After DNA damage by ionizing radiations, misrepair of broken pieces can produce a dicentric chromosome, this type of aberration can easily be visualized using solid stain. In theory there is the same probability for radiation to form a dicentric or a reciprocal translocation. There is experimental evidence supporting a 1:1 ratio. Translocations can be visualized after laborious banded karyotyping or more easily by FISH
FISH Fluorescence in situ Hybridization (FISH) techniques using DNA probes that hybridize with the entire chromosome length produces multicoloured“Chromosome painting”
Example: accident in Estonia (1) After the accident the frequency of dicentrics decreases clearly as time passes Data from: Lindholm, Int.J. Radiat. Biol. 70: 647-656 (1996) Lindholm et al., Int.J. Radiat. Biol. 74: 565-571 (1998) Lindholm and Edwards, Int.J. Radiat. Biol. 80: 559-566 (2004)
Example: accident in Estonia (2) But the frequency of translocations remained relatively constant Data from: Lindholm, Int.J. Radiat. Biol. 70: 647-656 (1996) Lindholm et al., Int.J. Radiat. Biol. 74: 565-571 (1998) Lindholm and Edwards, Int.J. Radiat. Biol. 80: 559-566 (2004)
Main steps of the FISH technique Cocktail of DNA probes labelled with fluorochromes Fixed cells on slides Denaturation of probe and target Hybridization and post-hybridization washes Counterstain with a fluorescent dye, and analysis using fluorescence microscopy
FISH techniques have many applications in medicine and in fundamental cytogenetics and can be applied to metaphases and nuclei Binucleated lymphocytes hybridized with centrometric specific probes for chromosomes 4 (green and red labelled DNA probes, resulting in a yellow signal), chromosome 7 (green labelled) and 18 (red labelled). Human metaphase with monocoloured painted chromosomes #1, #4 and #11 labeled with Cy3 (red), centromeres highlighted with a pancetromeric probe labeled with FITC (green), and the rest counterstained with DAPI.
With range of probes and fluorochrome combinations now commercially available it is possible to highlight all chromosomes by method known as multicolour FISH (mFISH). This permits full karyotyping and thus scoring all inter-chromosomal translocations. Centromeres and telomeres of all chromosomes can be separately highlighted too. Left picture: using pan-telomeric (red signals) and pan-centromeric probes (green signals), white arrows indicate centric-chromosome fragments lacking telomeric signals at one end (indicating an incomplete aberration); yellow arrows indicate two acentric fragments, and the red arrow a tricentric. Right picture an mFISH karyotype where each chromosome pair can be analyzed individually; white arrows indicate an exchange between chromosomes 6 and 11, and the yellow arrows between 11 and 12.
For biological dosimetry purposes most common technique is to “paint” several chromosomes with one or more fluorochromes, and to detect aberrations between “painted” and “unpainted” genomic material Human metaphase with coloured painted chromosomes #2 (FITC, green), #4 (Texas Red) and #8 (FITC+Texas Red, yellow), and the rest counterstained with DAPI. An apparently simple translocation, or two-way translocation [t(Ba),t(Ab)] involving chromosome # 2 is observed.
Because the aberrations detected are those between painted and unpainted material, efficiency in detecting translocations depends on number of painted chromosomes Using a mono-coloured cocktail of chromosomes, and according to the Lucas’ formula, the efficiency in detecting bicoloured aberrations is 2.05·fp·(1-fp). The maximum efficiency will be with painting 50% of the genome.
Routine FISH analysis • Generally, painting three of larger chromosomes (i.e. #1 to #12), representing about 20% of genome, leads to about 33% efficiency in detecting translocations when single colour is used. Percentage of the genome that each cocktail ‘paints’ is related to total genome considering the physical lengths of chromosomes • It is advisable not to include chromosomes 7 or 14 in probe combinations, as translocations and other aberrations involving these chromosomes can arise in vivo during immunological development and may thus confound quantification of radiation effect • For retrospective biological dosimetry single colour FISH for triple cocktail of target chromosomes appears to be sufficient. Multiple colour painting of triplet increases detection efficiency (if chromosomes #1, #4 and #12 are highlighted from about 31% to about 34%) and gives better detection of complex translocations that can be encountered following high recent exposures
Scoring criteria There is consensus on which metaphases should be scored. Well-spread metaphases are considered suitable for scoring if cells appear to be intact, centromeres are morphologically detectable and present in all painted chromosomes, and fluorochrome labelling is sufficiently bright to detect exchanges between chromosomes. Human metaphase with coloured painted chromosomes #1 (FITC, green), #4 (FITC+Cy3 yellow) and #11 (Cy2, red), centromeres highlighted with pancentromeric probe labelled with Cy3 (red), and rest counterstained with DAPI. Simple translocation, or two-way translocation [t(Bc),t(Cb)] involving chromosomes # 1 and 11 is observed.
Nomenclature To describe the chromosome aberrations detected by painting two specific nomenclature systems were developed independently and descriptions based on the conventional terminology of routine cytogenetic scoring were also used. Protocol for Aberration Identification and Nomenclature Terminology (PAINT) was developed to be purely descriptive of each aberrant painted object in the metaphase, without cross-reference to other aberrant objects in the cell. Each colour is designated by a letter, starting alphabetically with the counterstain. Capital letters designate the component that bears a centromere, and multiple coloured painting is accommodated by including further letters in the nomenclature. Tucker et al., Cytogenet Cell Genet. 68:211-221 (1995). Counterstained a A Painted 1 colour b B Painted 2 colour c C Painted 3 colour d D Examples t(Ba) t-ins(Abab) dic(BA) t(Ab)
Savage and Simpson (S&S) proposed a terminology comprising numerals and letters describing each exchange in its entirety. The exchanges were classified according to the number of chromosomes (C), the number of arms (A) and the number breaks (B) involved (CAB families). This so-called S&S system applies only to single paint patterns. However, it can be used with dual and triple paint patterns but each painted chromosome has to be scored in isolation irrespective of the colours of partners. This nomenclature has considerable uses in mechanistic studies, particularly, for example, in understanding complex rearrangements. Examples Number of breaks needed 2 2 2B The nomenclature contains aberrations from CAB 2/2/2 to 5/5/5, and it is difficult to handle. So, for retrospective studies is not suitable. But has a lot of interest for mechanistic studies. 3 2A 2G Name of the exchange 3 2F
A more conventional terminology may be employed that names translocations as reciprocal or terminal. Reciprocal has also been called complete or two-way, and terminal is also called incomplete or one-way. Reciprocal Terminal Incomplete, or one-way translocations Complete, or two-way translocation
Nomenclature used in practice • Nowadays most widely used method for recording data is to describe each abnormal metaphase as a unit using PAINT nomenclaturebut in slightly modified waythat considers underlying mechanisms of formation of aberrations • Abbreviations of PAINT system are used but a note is made of associations between objectsin metaphase, thereby incorporating aspects of the conventional terminology too • Chromosome aberrations are classified as simpleor complex, latter being when three or more breaks in two or more chromosomes are needed to produce observed abnormality. Aberrations are considered completewhen all broken pieces are rejoined and as incompletewhen one or more pieces appear unrejoined
This metaphase contains a dicentric between two painted chromosomes and a dicentric between two unpainted chromosomes. So a dic (BB)+ace (b) plus and dic (AA)+ace(a) dic(BB) ace(b) dic(AA)ace(a)
More examples Ins(Bab) Ins(Aba)
What is stable? This metaphase contains dicentric between unpainted chromosomes and translocation between painted and unpainted chromosomes. So, dic(AA)+ace(a) plus and t(Ba)+t(Ab). It is important to consider that translocation is stable aberration, but this cell is unstable due to presence of dicentric and its acentric t(Ba) t(Ba) Dic(AA) ace(a)
Dose-Effect Curves Similar to dicentrics, for dose estimations with translocations detected by FISH, each laboratory needs to establish its own curves. Curve should be made with same FISH probe cocktail that is routinely used for case investigations. Doing this removes need to convert to genome equivalence which could introduce some extra uncertainty It is recommended to score all aberrations detected in entire chromosome set, not just those affecting the painted material, but also those affecting unpainted material. This allows one to establish dose-effect curves for translocations in stable cells (cells without dicentrics, rings or acentrics)
Dose-Effect Curves However, it should be pointed that for low-LET radiations, when calibration curves for translocations have been constructed taking into account stable or total cells, there were no differences in the fitted coefficients if only apparently simple translocations were considered Doseeffect curves forall simple translocationsobserved in allcells, orthoseonly in stablecells t(Ba)+t(Ab) two-way translocation t(Ab) one-way translocations + t(Ba) All simple translocations
Data Handling • When only translocations between painted and unpainted chromosomes material are scored it may be necessary to convert observed frequency to full genome equivalence • Conversion is recommended procedure to use when data have to be combined or intercomparisonshave to be made between results from various studies where different combinations of whole chromosome painting probes have been used • Assumption, sometimes referred to as Lucas formula, is that probability of the involvement of particular painted chromosome in aberration is proportional to its DNA content. This assumption gives reasonable approximation. However, there is consensus that when using the (DNA content) in Lucas formula, larger chromosomes may tend to be overestimated in their participation in simple exchange aberrations compared to smaller ones • Therefore, use in Lucas formula of (DNA content)2/3rather than (DNA content) gives more accurate results. Some authors have argued that this kind of proportionality could be symptomatic of interchanges involving primarily chromatin near boundary of chromosome territories
Genomic equivalence- painting with one colour fp is the fraction of the genome covered by the DNA probes, and 1-fp the remainder unpainted genome All possible exchanges are between: painted and painted Can not be detected painted and unpainted Can be detected unpainted and painted unpainted and unpainted Can not be detected Intrachromosomal exchanges, that can not be detected = 0.026. This number depends on the number of human chromosomes and the relative DNA content of them. Ifthe total exchangesisFG, and thethefraction of allexchangesthan can bedetectedisFpthen : Thegenomicequivalentfrequency of translocationiscalculatedusingthis formula
Example If chromosome pairs 1, 2 and 4 are painted. Their respective DNA contents (male) are 0.0828, 0.0804 and 0.0639. 2743. Therefore, fp = 0.2271, so that FP/FG = 0.360 This combination of chromosomes painted is 36% efficient in measuring bicoloured translocations. Therefore, to obtain the full genome translocation yield the observed yield is divided by 0.36
Control Level of Translocations (1) • Control levels of translocations are higher than for dicentrics, and to some extent this is due to translocations being a persisting type of aberration • It is therefore important to take the translocation background into account, particularly after low doses, when attempting retrospective biodosimetry
Control Level of Translocations (2) • Comprehensive meta-analysis currently provides best international database, broken down by age, gender, race and smoking habits (Sigurdson et al. 2008) • It is clear that age is major factor that determines background frequency of translocations
Age-control relationship From number of translocations observed in individual, it is important to subtract the generic background frequency expected for his or her age This is genomic equivalent frequency Data from Sigurdson et al., Mutat. Res 652:112-121 (2008)