Two-Dimensional Reference Maps of Castor Seed Proteins Across Developmental Stages
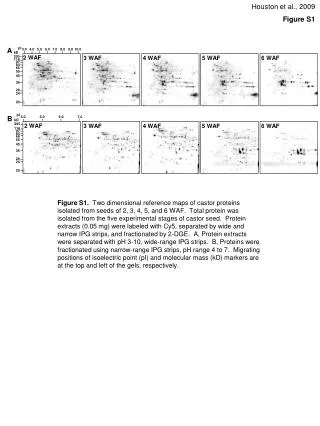
This figure illustrates the two-dimensional reference maps of proteins isolated from different developmental stages (WAF 2 to 6) of castor seed. Total protein was extracted and labeled with Cy5, followed by separation using wide and narrow isoelectric focusing (IPG) strips, then fractionated by 2-D gel electrophoresis (2-DGE). Part A represents the proteins separated on wide-range IPG strips (pH 3-10), while Part B showcases the proteins on narrow-range IPG strips (pH 4-7). The positions of isoelectric points (pI) and molecular mass (kD) markers are indicated along the top and left sides of the gels.

Two-Dimensional Reference Maps of Castor Seed Proteins Across Developmental Stages
E N D
Presentation Transcript
Houston et al., 2009 Figure S1 3 WAF 4 WAF pI A 3.0 4.0 5.0 6.0 7.0 8.0 9.0 10.0 kD 2 WAF 205 116 97 84 66 55 45 36 29 24 20 pI B 4.0 5.0 6.0 7.0 kD 5 WAF 6 WAF 205 116 97 84 66 55 45 36 29 24 20 2 WAF 3 WAF 4 WAF 5 WAF 6 WAF Figure S1. Two dimensional reference maps of castor proteins isolated from seeds of 2, 3, 4, 5, and 6 WAF. Total protein was isolated from the five experimental stages of castor seed. Protein extracts (0.05 mg) were labeled with Cy5, separated by wide and narrow IPG strips, and fractionated by 2-DGE. A, Protein extracts were separated with pH 3-10, wide-range IPG strips. B, Proteins were fractionated using narrow-range IPG strips, pH range 4 to 7. Migrating positions of isoelectric point (pI) and molecular mass (kD) markers are at the top and left of the gels, respectively.