Download
1 / 7
70 likes | 256 Vues
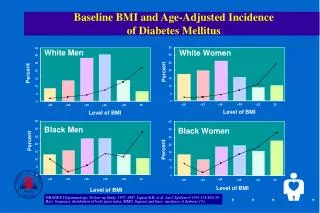
Baseline BMI and Age-Adjusted Incidence of Diabetes Mellitus. 35. 35. White Men. White Women. 30. 30. 25. 25. Percent. 20. Percent. 20. 15. 15. 10. 10. 5. 5. 0. 0. <29. <20. <23. <26. <32. 32. <20. <23. <26. <32. 32. <29. Level of BMI. Level of BMI. 35. 35.

E N D
Baseline BMI and Age-Adjusted Incidence of Diabetes Mellitus 35 35 White Men White Women 30 30 25 25 Percent 20 Percent 20 15 15 10 10 5 5 0 0 <29 <20 <23 <26 <32 32 <20 <23 <26 <32 32 <29 Level of BMI Level of BMI 35 35 Black Men Black Women 30 30 25 25 Percent 20 20 Percent 15 15 10 10 5 5 0 0 <20 <23 <26 <29 <32 32 <26 <20 <23 <29 <32 32 Level of BMI Level of BMI NHANES I Epidemiologic Follow-up Study. 1971-1987. Lipton R.B. et al. Am J Epidemiol 1993;138:826-39. Bars: frequency distribution of body mass index (BMI). Squares and lines: incidence of diabetes (%).
Obesity and Diabetes Risk Incidence of New Cases per 1,000 Person-Years BMI Levels Knowler WC et al. Am J Epidemiol 1981;113:144-156.
Weight Gain and Diabetes Risk Weight Change Since Age 21 Relative Risk Body Mass Index at Age 21 Adapted from Chan JM et al. Diabetes Care 1994;17:960-969.
Metabolic Characteristics of Non-Obese and Obese Women With Low and High Levels of Deep Abdominal Fat *Significantly different from non-obese women. +Significantly different from obese women with low levels of deep abdominal fat, p<0.05. The values represent means + SD. The number of subjects is shown in parentheses. Triglyceride data were log 10 transformed for statistical analysis. Despres JP et al. Arteriosclerosis 1990;10:497-511.
26 -Year Incidence of Coronary Heart Disease in Men Incidence/1,000 BMI Levels Adapted from Hubert HB et al. Circulation 1983;67:968-977. Metropolitan Relative Weight of 110 is a BMI of approximately 25.
26 -Year Incidence of Coronary Heart Disease in Women Incidence/1,000 BMI Levels Adapted from Hubert HB et al. Circulation 1983;67:968-977. Metropolitan Relative Weight of 110 is a BMI of approximately 25.
Relationship of BMI to Excess Mortality Bray GA. Overweight is risking fate. Definition, classification, prevalence and risks. Ann NY Acad Sci 1987;499:14-28. 300 Age at Issue 20-29 250 30-39 200 150 Mortality Ratio 100 High Moderate Low Risk Risk Risk 50 0 15 20 25 30 35 40 Body Mass Index (kg/[m2])