Download
1 / 10
100 likes | 270 Vues
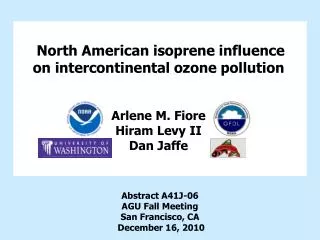
North American isoprene influence on intercontinental ozone pollution. Arlene M. Fiore Hiram Levy II Dan Jaffe. Abstract A41J-06 AGU Fall Meeting San Francisco, CA December 16, 2010. O 3. CO, VOC + NO x. O 3. isoprene.

E N D
North American isoprene influence on intercontinental ozone pollution Arlene M. Fiore Hiram Levy II Dan Jaffe Abstract A41J-06 AGU Fall Meeting San Francisco, CA December 16, 2010
O3 CO, VOC + NOx O3 isoprene What role does isoprene play in intercontinental O3 transport? OCEAN NORTH AMERICA (NA) EUROPE (EU) KEY FINDINGS (MOZART-2 global model) EU surface O3 decrease from -20% NA anthrop. emissions: 1. could be offset by increases in isoprene (warmer climate, land-use) 2. shows little sensitivity to uncertain isoprene source magnitude or isoprene nitrate recycling
Approach: Sensitivity simulations in MOZART-2 global CTM, expanding on TF HTAP multi-model studies www.htap.org TF HTAP, 2007, 2010; Sanderson et al., GRL, 2008; Shindell et al., ACP, 2008; Fiore et al., JGR, 2009, Reidmiller et al. ACP, 2009; Anenberg et al., ES&T, 2009; Jonson et al., ACPD,2010 O3 Isoprene >>AVOC • 1. Base Simulation in MOZART-2 global CTM: • 1.9°x1.9°; 2001 NCEP meteorology Anthropogenic emissions as in Horowitz et al. [2003] • GFED v2 for biomass burning [van derWerf et al.; 2006] 2. Suite of simulations changing NA emissions by: -20% anthrop. NOx, NMVOC, separately -20% all anthrop. (NOx+CO+NMVOC+aerosol) +20% isoprene • +20% isoprene and -20% all anthropogenic 3. Different baselines to estimate all NA anthrop. influence on EU O3 isoprene nitrate recycling (100% vs 40%) +20% isoprene emissions
Surface O3 response over Europe (spatial average) to North American (NA) emission perturbations -20% NA anthrop. NOx+CO+NMVOC Surface ozone decrease over Europe (ppb) -20% NA anthrop. NOx Surface ozone increase over Europe (ppb) +20% NA isoprene -20% NA anthrop. NMVOC EU O3 response to NA isoprene comparable to anthrop. NOx in summer/fall; larger than anthrop. NMVOC
Surface O3 over Europe (spatial average) to -20% North American emission perturbations EU O3 decrease is smaller by ~50% when NA isoprene increases by 20% -20% all NA anthrop. emissions Interannual variations in NA isoprene emissions ~ 20-30% [Palmer et al. 2006] Surface ozone decrease over Europe (ppb) -20% all NA anthrop. AND +20% NA isoprene Consider potential changes in isoprene (climate, land-use) in future scenarios for emission controls to lower hemispheric O3
Prior studies show a wide range in model estimates of EU surface O3 response to NA anthrop. emissions Multi-model mean Generally not associated with model differences in anthropogenic emissions [Fiore et al., 2009] Surface ozone decrease over Europe (ppb) Individual models, TF HTAP studies Does the range reflect model differences in size of isoprene source and/or isoprene nitrate chemistry?
Surface O3 response over Europe (spatial average) to -20% all North American anthropogenic emissions Isoprene nitrates O3 Baseline (previous) ISOP. + NOx ? +20% NA isoprene Surface ozone decrease over Europe (ppb) 40% NOxrecycling 100% NOx recycling Cross-model differences not explained by different treatments of isoprene emission magnitude or isoprene nitrate recycling
PAN O3 O3 PAN NMVOC + NOx O3 CH3C(O)OONO2 isoprene PAN: A pathway (and a proxy ?)for source regions to influence foreign O3 OCEAN NORTH AMERICA (NA) EUROPE (EU) PAN as a PATHWAY: contributes to O3 far downwind [e.g., Moxim et al., 1996; Heald et al.,2003; Hudman et al., 2004; Zhang et al., 2008; Fischer et al., 2010; Lin et al., 2010] PAN as a PROXY: may reflect changes in O3 precursor sources better than O3 itself [Jaffe et al., 2007; Fischer et al., 2010]
PAN is relatively more sensitive than O3 to anthropogenic and isoprene emission changes (August) -20% ALL NA anthrop. emissions +20% NA isoprene emissions OZONE at 700 hPa PAN at 700 hPa % change PICO-NARE site well-positioned for sampling N. American outflow [e.g., Honrath et al., JGR, 2004; val Martin et al., JGR, 2008.]
North American isoprene vs. anthropogenic influence on intercontinental O3 pollution: Conclusions and implications EU surface O3 decrease from -20% NA anthrop. emissions: 1. could be offset by increases in isoprene (warmer climate, land-use) 2. shows little sensitivity to uncertain isoprene source magnitude or isoprene nitrate recycling • Include biogenics when assessing impacts of human activities (& consider as anthropogenic, e.g. land-use)? PAN may be a proxy for regional emission changes Establish long-term PAN observing sites in the lower free troposphere in key locations? For more info or to join the discussion (open at ACPD through 12/20/10): http://www.atmos-chem-phys-discuss.net/10/24821/2010/acpd-10-24821-2010-discussion.html