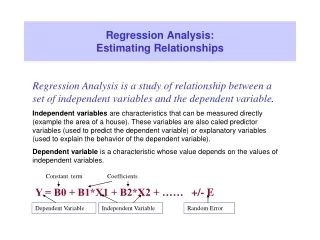
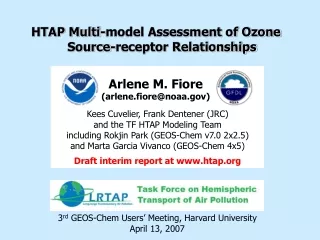
Estimating Intercontinental Source-Receptor Relationships for Ozone Pollution
Estimating Intercontinental Source-Receptor Relationships for Ozone Pollution. Arlene M. Fiore (arlene.fiore@noaa.gov). Kees Cuvelier, Frank Dentener (JRC) and the TF HTAP Modeling Team. Department of Environmental Sciences, Rutgers University March 30, 2007.

Estimating Intercontinental Source-Receptor Relationships for Ozone Pollution
E N D
Presentation Transcript
Estimating Intercontinental Source-Receptor Relationships for Ozone Pollution Arlene M. Fiore (arlene.fiore@noaa.gov) Kees Cuvelier, Frank Dentener (JRC) and the TF HTAP Modeling Team Department of Environmental Sciences, Rutgers University March 30, 2007
Example of intercontinental transport at northern midlatitudes: 2001 Asian dust event Clear Day April 16, 2001 Dust leaving the Asian coast in April 2001 Image c/o NASA SeaWiFS Project and ORBIMAGE Reduced Visibility from Transpacific Transport of Asian Dust Glen Canyon, Arizona A.M. Fiore
How do we estimate source-receptor relationships that describe hemispheric transport of air pollution? 3D Model Structure Models with domestic anthropogenic emissions turned off? Measurements at remote sites? (Monitoring site at Yosemite NP) Difficult to directly measure a region’s contribution to pollution over a receptor region, particularly for ozone [e.g.Goldstein et al., 2004] A.M. Fiore
Hemispheric Transport of Ozone Stratospheric O3 Stratosphere O3 ~12 km hn Free Troposphere NO NO2 Hemispheric Pollution OH HO2 Direct Intercontinental Transport Boundary layer (0-3 km) VOC, CH4, CO air pollution (smog) NOx VOC O3 NOx VOC O3 air pollution (smog) CONTINENT 1 CONTINENT 2 OCEAN A.M. Fiore
Hemispheric scale contribution of major source regions to NH surface ozone in summer North America Estimated with model simulations that zero out anthropogenic emissions of O3 precursors within the source region Europe GEOS-Chem Model 4°x5° horizontal resolution Li et al., JGR, 2002 Asia
Changes in global anthropogenic emissions affect regional air quality 1995 Base case 2030 A1 longer O3 season GEOS-Chem Model (4°x5°) [Fiore et al., GRL, 2002] Rising global emissions may offset U.S. efforts to reduce pollution
Rising background O3 has implications for attaining air quality standards Pre-industrial background Current background Future background? Surface O3 background appears to be rising [e.g. Lin et al., 2000; Jaffe et al., 2003, 2005; Vingarzan, 2004; EMEP/CCC-Report 1/2005 ] Europe seasonal WHO/Europe 8-hr average U.S. 8-hr average 20 40 60 80 100 O3 (ppbv) A.M. Fiore
The U.S. smog problem is spatially widespread, affecting >100 million people [U.S. EPA, 2004] AEROSOLS (particulate matter) OZONE Annual Average PM2.5 in 2003 Nonattainment Areas (2001-2003 data) Exceeds standard U.S. EPA, 2004 U.S. EPA, 2006 4th highest daily max 8-hr O3> 84 ppbv
Convention on Long-Range Transboundary Air Pollution (CLRTAP) 49 parties in Europe, North America, and Central Asia Co-chairs: Terry Keating (U.S. EPA) and André Zuber (EC) TF HTAP Mission: Develop a fuller understanding of hemispheric transport of air pollution to inform future negotiations under CLRTAP
Thin dashes: seasonal mean Thick dashes: events Solid bars: annual means Literature Estimates of Surface O3 Enhancements at Northern Mid-latitudes from Hemispheric Transport RECEPTOR REGIONS USA EU ASIA SOURCE REGIONS: N. AMERICAEUROPEASIABACKGROUND Estimates are from studies cited in current draft of TF HTAP interim report Ch5, updated from tables in Holloway et al., ES&T, 2003 and Fiore et al., EM, 2003 Difficult to conduct meaningful assessment due to differences in: 1) methods 2) regional definitions 3) reported metrics A.M. Fiore
EU NA EA SA Multi-model assessment involving ~20 modeling groups OBJECTIVES: Quantify source-receptor relationships for HTAP regions and assess uncertainties in these estimates HTAP Source-Receptor Regions • Focus species: • Ozone and precursors • Aerosols and precursors • Mercury • Persistent Organic Pollutants • Idealized Tracers PRODUCTS: 2007 Interim Reportto inform the review of the 1999 CLRTAP Gothenburg Protocol to abate acidification, eutrophication, and tropospheric ozone. (draft report available for comment at www.htap.org) 2009 Assessment Reportto inform the CLRTAP on hemispheric air pollution and source-receptor relationships.
14 modeling groups have submitted results for HTAP ozone intercomparison (March, 2007)
EU NA EA SA Overview of HTAP Model Intercomparison for Ozone APPROACH: Conduct base simulation with 3-D models horizontal resolution of 4°x5° or finer 2001 meteorology each group’s best estimate for emissions in 2001 methane set to a uniform value of 1760 ppb Conduct sensitivity simulations (17 total) 20% decreases in: • anthrop. emis. in HTAP regions for NOx, CO, NMVOC individually • anthrop. emis. of all O3 and aerosol precursors in HTAP regions • global CH4
Seasonal cycles in simulated surface O3 over the HTAP regions: Results from individual models ppbv Model range often spans ~15 ppbv A.M. Fiore
Recent ACCENT multi-model surface O3 vs. observations in HTAP regions: NA and EU North America OBS Multi-model mean standard deviation range SW US: 11 sites SE US: 12 sites US Great Lakes: 13 Europe and North Africa C. Mediterranean: 21 C. Europe: 101 sites Middle East: 1 site 25 participating models Ellingsen et al., in prep
S(20% decreases in foreign NOx) 20% decreases in domestic NOx = 30-85% EU NA EA SA Estimates of S-R relationships: Annual mean surface O3 decrease from 20% reductions in anthropogenic NOx emissions Source region Full range of 11 individual models Receptor: Largest source-receptor pair: NAEU But… seasonality in sensitivity to domestic vs. foreign NOx sources? A.M. Fiore
Monthly mean surface O3 change in EU from 20% reductions of domestic NOx emissions Large seasonality masked by annual mean statistic A.M. Fiore
Estimates of S-R relationships: Smaller relative contributions from foreign NOx sources during season of max domestic ozone production S(20% decreases in foreign NOx) 20% decreases in domestic NOx = 10-30% Source region Largest HTAP influence on SA Similar impact from all 3 foreign source regions on EA Smallest HTAP influence on NA Largest S-R pair: NAEU Decrease in surface O3 (ppbv) Season: JJA JJA SON JJA • Examine springtime when intercontinental transport typically peaks • Compare role of NOx emissions with other O3 precursors A.M. Fiore
SOURCE REGIONS Strong VOC sensitivity S(-20% foreign emis.) -20% domestic emis. S(-20% foreign emis.) -20% domestic emis. ≈ 70% ≈ 50% Estimates of S-R relationships: Springtime surface O3 decrease in HTAP receptor regions from 20% reductions of O3 precursors RECEPTOR = EUROPE Multi-model means indicate: NA contributes most ppbv RECEPTOR = NORTH AMERICA EA/EU contribute similarly EU VOC at least as important as NOx ppbv A.M. Fiore
SOURCE REGIONS S(-20% foreign emis.) -20% domestic emis. S(-20% foreign emis.) -20% domestic emis. ≈ 50% ≈ 80% Larger uncertainty in role of foreign VOC Estimates of S-R relationships: Springtime mean surface O3 decrease in HTAP receptor regions from 20% reductions of O3 precursors RECEPTOR = SOUTH ASIA Multi-model means indicate: EU contributes most NA > EA RECEPTOR = EAST ASIA EU and NA NOx contribute similarly but stronger EU VOC influence EU and NA > SA A.M. Fiore
Enhanced effect in source region <10% other NH source regions < 5% rest of NH <1% most of SH Percentage Difference: DAsia – Duniform DAsia • Target cheapest controls worldwide Global surface ozone response to CH4 emission controls is independent of source location Change in July surface O3 from 30% decrease in anthropogenic CH4 emissions Globally uniform emission reduction Emission reduction in Asia 1.9°x1.9° A.M. Fiore
MOZART-2 [West et al., PNAS 2006; Fiore et al., in prep] TM3 [Dentener et al., ACP, 2005] GISS [Shindell et al., GRL, 2005] GEOS-CHEM [Fiore et al., GRL, 2002] IPCC TAR [Prather et al., 2001] X Tropospheric O3 responds approximately linearly to anthropogenic CH4 emission changes across models Anthropogenic CH4 contributes ~50 Tg (~15%) to tropospheric O3 burden ~5 ppbv to surface O3 A.M. Fiore
Surface ozone decreases similarly in all HTAP regions when global methane is reduced Full range of 12 individual models EUROPE N. AMER. S. ASIA E. ASIA • 1 ppbv O3 decrease over all NH receptor regions • Consistent with prior studies What causes the range across individual models? -- examine ozone production efficiency; NOx:VOC ratios A.M. Fiore
Some remaining questions...(to be examined as part of the TF HTAP project) • Which processes contribute most to the inter-model range in S-R relationships? • Insights from idealized tracer experiments • Normalize response to emission perturbations to “remove” uncertainty due to differences in emission inventories • How can we best test models of hemispheric transport of air pollution? Need to test processes (export, chemical evolution, mixing into surface air) • Does the response to 20% decreases in emissions scale to reductions of different magnitude? Yes for CH4; simulations underway for NOx(expected to be more non-linear) and combined O3 precursor reductions • What is the contribution of hemispheric transport to polluted vs. “average” vs. clean conditions)? Analysis underway to compare range of model responses at different places in the overall O3 distribution • How will climate change affect hemispheric transport of air pollution? Expected to influence production, loss, transport A.M. Fiore
Example observations at high-altitude sites for testing long-range transport in models Mt. Bachelor Observatory in central Oregon – April 25, 2004 (c/o Dan Jaffe U Washington) Ozone (ppb) at Jungfraujoch, Switzerland June-August 2000 (3.5 km) [Guerova et al., 2006] observed modeled O3 from North America Europe Stratosphere Asian industrial plume diagnosed via back- trajectories, a 3-D model, Hg/CO signature [Jaffe et al.,2005; Weiss-Penzias et al.,2006] • Insights into model capability at representing specific processes by integrating analysis of data from model, aircraft, satellite, sondes, surface sites? A.M. Fiore
Maximum intercontinental influence occursnear the center of the overall O3 distribution Impact of a 20% decrease in NA anthrop. NOx to EA surface O3 (Jun 1 - Aug 31 2001) 0.5 0.0 -0.5 -1.0 -1.5 Mean of 10 ppb bins Change in ozone (ppbv) Each point is 1 daily max 8-hr avg surface O3 in 1 model grid cell MOZART-2 model at GFDL 0 20 40 60 80 100 120 Base case daily max 8-hr O3 (ppbv) Is this result robust across the HTAP models? 1.9°x1.9° A.M. Fiore
Consistent results from earlier study: Enhancements from Asian/European pollution over the U.S. in summer as determined from a simulation without these emissions (GEOS-Chem 4°x5°) Subsidence of Asian pollution + local production stagnation Max Asian/European pollution enhancements (up to 14 ppbv) occur at intermediate ozone levels (50-70 ppbv) tropical air • Major concern if national ozone standard were to decrease Fiore et al., JGR, 2002
Global background ozone may decrease in a warmer, more humid climate Mean annual change in number of days where daily max 8-hr O3 > 80 ppbv (2090-2100 A1) – (1990-2000) Less trans-Pacific transport Increase in polluted (high-NOx) regions More inflow of clean air from Gulf of Mexico MOZART-2 global tropospheric chemistry model with meteorology from NCAR climate model [Murazaki and Hess, J. Geophys. Res., 2006]
Conclusions: Intercontinental Source-Receptor Relationships for Ozone • Range of estimates narrows from that in the literature under HTAP setup • Multi-model mean results indicate that S(-20% foreign NOx)/(-20% domestic NOx) ranges from • 10-30% during the season of maximum local O3 production • 35-70% in spring • Larger multi-model mean sensitivity to 20% decreases in NOx+NMVOC+CO (in spring, peak HTAP season): S(-20% foreign O3 precursors)/(-20% domestic O3 precursors) = 50-80% • 0.6-0.8 ppbv surface O3 response to the sum of the 3 foreign source regions • 0.9-1.2 ppbv response to domestic emissions • EU more sensitive to domestic NMVOC emissions than other HTAP regions • Smaller contribution from HTAP to high-O3 events than to mean conditions • Robust model response of a ~1 ppbv (1.0-1.8) decrease in annual mean surface O3 over HTAP regions when global CH4 is reduced by 20% • Response scales linearly to perturbations of different magnitudes • Response independent of location target cheapest controls worldwide A.M. Fiore