Download

1 / 10
100 likes | 285 Vues
HTAP Multi-model Assessment of Ozone Source-receptor Relationships. Arlene M. Fiore (arlene.fiore@noaa.gov). Kees Cuvelier, Frank Dentener (JRC) and the TF HTAP Modeling Team including Rokjin Park (GEOS-Chem v7.0 2x2.5) and Marta Garcia Vivanco (GEOS-Chem 4x5)

E N D
HTAP Multi-model Assessment of Ozone Source-receptor Relationships Arlene M. Fiore (arlene.fiore@noaa.gov) Kees Cuvelier, Frank Dentener (JRC) and the TF HTAP Modeling Team including Rokjin Park (GEOS-Chem v7.0 2x2.5) and Marta Garcia Vivanco (GEOS-Chem 4x5) Draft interim report at www.htap.org 3rd GEOS-Chem Users’ Meeting, Harvard University April 13, 2007
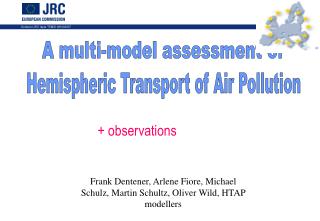
TF HTAP mission: Develop a fuller understanding of hemispheric transport of air pollution to inform future negotiations under CLRTAP Convention on Long-Range Transboundary Air Pollution (CLRTAP) 49 parties in Europe, North America, and Central Asia Co-chairs: Terry Keating (U.S. EPA) and André Zuber (EC) TF HTAP Products: 2007 (Interim) and 2009 (Final) Assessment reports
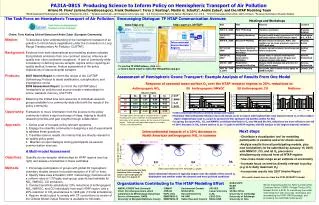
Thin dashes: seasonal mean Thick dashes: events Solid bars: annual means Literature Estimates of Surface O3 Enhancements at Northern Mid-latitudes from Hemispheric Transport RECEPTOR REGIONS USA EU ASIA SOURCE REGIONS: N. AMERICAEUROPEASIABACKGROUND Estimates are from studies cited in current draft of TF HTAP interim report Ch5, updated from tables in Holloway et al., ES&T, 2003 and Fiore et al., EM, 2003 Difficult to conduct meaningful assessment due to differences in: 1) methods 2) regional definitions 3) reported metrics A.M. Fiore
EU NA EA SA HTAP Multi-model approach to estimate intercontinental source-receptor (S-R) relationships for ozone Conduct base simulations with 3-D models horizontal resolution of 4°x5° or finer 2001 meteorology each group’s best estimate for emissions in 2001 methane set to a uniform value of 1760 ppb Conduct sensitivity simulations(17 total) 20% decreases in: • anthrop. emis. in HTAP regions for NOx, CO, NMVOC individually • anthrop. emis. of all O3 and aerosol precursors in HTAP regions • global CH4 A.M. Fiore
Surface O3 seasonal cycles in base simulations over the HTAP regions 17-model mean 17-model range GEOS-Chem 2x2.5 GEOS-Chem 4x5 Other HTAP O3 models: CAMCHEM ECHAM5-HAMMOZ EMEP FRSGCUCI GEMAQ INCA LLNL-IMPACT-T5a MOZARTGFDL MOZECH OsloCTM2 STOC-HadAM3 STOCHEM TM5-JRC ULAQ UM-CAM EU NA Surface O3 (ppbv) EA SA Month of 2001 Model range often spans ~15 ppbv A.M. Fiore
Recent ACCENT multi-model surface O3 vs. observations in HTAP regions: NA and EU North America OBS Multi-model mean standard deviation range SW US: 11 sites SE US: 12 sites US Great Lakes: 13 Europe and North Africa C. Mediterranean: 21 C. Europe: 101 sites Middle East: 1 site 25 participating models Year 2000 Ellingsen et al., in prep
x x x x x x x x x GEOS-Chem 2x2.5 x GEOS-Chem 4x5 Estimates of S-R relationships: Annual mean surface ozone decrease due to 20% global methane reduction 2.0 1.5 1.0 0.5 0.0 Full range of 14 models ppbv EUROPE N. AMER. S. ASIA E. ASIA HTAP receptor region • 1 ppbv O3 decrease over all NH receptor regions • Consistent with prior studies What causes the ~1 ppbv range across individual models? -- examine ozone production efficiency; NOx:VOC ratios A.M. Fiore
Estimates of S-R relationships: Sensitivity of surface O3 to NOx sources during season of max domestic O3 production 14 model range x GEOS-Chem x x x x x x x x x x x x x x x x x x x x S(20% decreases in foreign NOx) 20% decrease in domestic NOx = 10-30% Source region: Largest HTAP influence on SA Similar impact from all 3 foreign source regions Smallest HTAP influence on NA Largest S-R pair: NAEU Decrease in surface O3 (ppbv) Receptor region: Season:JJA JJA SON JJA • Examine springtime when intercontinental transport typically peaks • Compare role of NOx emissions with other O3 precursors A.M. Fiore
SOURCE REGIONS: S 3 foreign regions S(-20% foreign emis.) -20% domestic emis. S(-20% foreign emis.) -20% domestic emis. ≈ 85% ≈ 55% RECEPTOR = EAST ASIA EU and NA ≥ SA Larger uncertainty in role of foreign VOC ppbv Estimates of S-R relationships: Springtime surface O3 decrease in HTAP receptor regions from 20% reductions of O3 precursors RECEPTOR = NORTH AMERICA EA/EU contribute similarly EU VOC at least as important as NOx ppbv A.M. Fiore
Some remaining questions...(to be examined as part of the TF HTAP project) Overall conclusion from previous analysis: Range of estimates narrows from that in the literature under HTAP setup • Which processes contribute most to uncertainty in S-R relationships? • Insights from idealized tracer experiments • Normalize model response to emission perturbations • How can we best test models of hemispheric transport of air pollution? Need to test processes (export, chemical evolution, mixing to surface) • Can 20% emission decreases be scaled to reductions of other magnitudes? Yes for CH4; simulations underway for other O3 precursors • Role of hemispheric transport in polluted vs. background conditions? Examine range of model responses across the O3 distribution • How will climate change affect hemispheric transport of air pollution? www.htap.org for more info and to comment on draft 2007 interim report A.M. Fiore