Download
1 / 14
140 likes | 249 Vues
Investigating source-receptor relationships for ozone in HTAP regions, assessing uncertainties. Results of surface ozone simulations and observations analyzed for North America, Europe, and Asia.

E N D
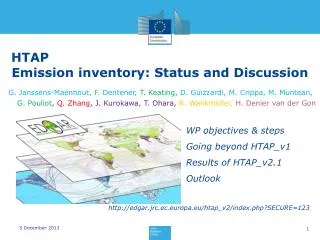
Preliminary Ozone Results from the TF HTAP Model Intercomparison Arlene M. Fiore (arlene.fiore@noaa.gov) Kees Cuvelier, Frank Dentener (JRC) and the HTAP Modeling Team HTAP Observations Workshop, WMO, Geneva, January 25, 2007
Thin dashes: seasonal mean Thick dashes: events Solid bars: annual means Literature Estimates of Surface O3 Enhancements at Northern Mid-latitudes from Hemispheric Transport RECEPTOR REGIONS USA EU ASIA SOURCE REGIONS: N. AMERICAEUROPEASIABACKGROUND Estimates are from studies cited in current draft of Interim report Ch5 Section B, updated from tables in Holloway et al., ES&T, 2003 and Fiore et al., EM, 2003 Difficult to conduct meaningful assessment due to differences in: 1) methods 2) regional definitions 3) reported metrics
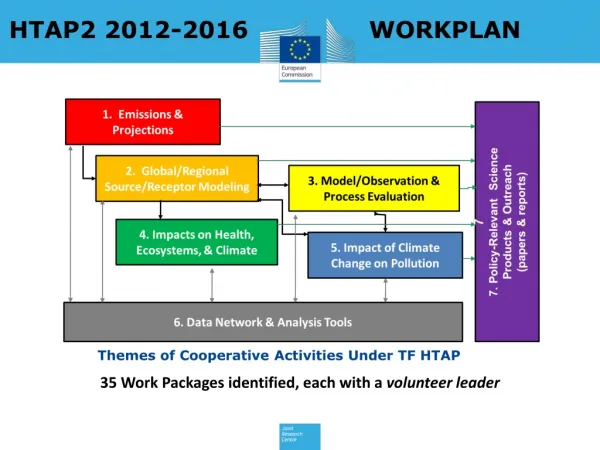
HTAP Source-Receptor Regions Overview of HTAP Model Intercomparison for Ozone OBJECTIVES: Quantify source-receptor relationships for HTAP regions and assess uncertainties in these estimates APPROACH: Conduct base simulation with 3-D models horizontal resolution of 4°x5° or finer 2001 meteorology each group’s best estimate for emissions in 2001 methane set to a uniform value of 1760 ppb Conduct sensitivity simulations (17 total) 20% decreases in: • anthrop. emis. in HTAP regions for NOx, CO, NMVOC individually • anthrop. emis. of all O3 and aerosol precursors in HTAP regions • global CH4 ~ 14 modeling groups have already delivered results for Experiment 1
Seasonal Cycles in Simulated Surface O3 over HTAP Regions: Results from Individual Models Model range often spans ~15 ppbv
Previous ACCENT Multi-model Surface O3 vs. Observations in HTAP Regions: NA and EU North America OBS Multi-model mean standard deviation range SW US: 11 sites SE US: 12 sites US Great Lakes: 13 Europe and North Africa C. Mediterranean: 21 C. Europe: 101 sites Middle East: 1 site Ellingsen et al., in prep
How Should We Test Models of Hemispheric O3 Transport? • Signatures of intercontinental transport in tracer correlations? • Observation-based estimates of HTAP? OBSERVATIONAL DATASETS FOR 2001 • Field campaigns (TRACE-P, ACE-Asia, PHOBEA-II, CONTRACE, STACCATO) • Vertical profiles (e.g. sonde network, MOZAIC, long-term sites) • Satellites • Surface monitoring networks (CASTNet/AIRS; EMEP; EANET) • Event-based analysis at sites where long-range transport has been detected? • Others?
EA/EU contribute similarly EU VOC at least as important as NOx NANA 0.8 0.2 0.2 1.1 ppbv Annual Mean Surface O3 Decrease in HTAP Receptor Regions from 20% Reductions of O3 Precursors Multi-model means indicate: NA contributes most EUEU 0.5 0.4 0.1 1.0 ppbv (multi-model mean)
Annual Mean Surface O3 Decrease in HTAP Receptor Regions from 20% Reductions of O3 Precursors Multi-model means indicate: EU contributes most EA contribution ≈ NA SASA 1.1 0.2 0.2 1.1 ppbv EU and NA NOx contribute similarly but stronger EU VOC influence EU and NA > SA EAEA 0.6 0.2 0.2 0.9 ppbv Does response to 20% reductions scale linearly to other magnitudes?
Full range of individual models Surface Ozone Decreases Similarly in all HTAP Regions When Global Methane is Reduced • 1 ppbv O3 decrease over all NH receptor regions • Consistent with prior studies What causes the ~1 ppb range across individual models? -- examine ozone production efficiency; NOx:VOC ratios Is there seasonality in the response?
MOZART-2 [West et al., PNAS 2006; Fiore et al., in prep] TM3 [Dentener et al., ACP, 2005] GISS [Shindell et al., GRL, 2005] GEOS-CHEM [Fiore et al., GRL, 2002] IPCC TAR [Prather et al., 2001] X Tropospheric O3 Responds Approximately Linearly to Anthropogenic CH4 Emission Changes Across Models Anthropogenic CH4 contributes ~50 Tg (~15%) to tropospheric O3 burden ~5 ppbv to surface O3
B B A B B B B A B Annual Mean Surface O3 Response to Global CH4 Decrease of 20% in HTAP Models Likely reflects model differences in NOx; transport patterns also?
Intercontinental influence typically largest near the middle of the overall O3 distribution • Consistent with prior work on intercontinental influence on O3 in surface air over the United States [Fiore et al., 2002] and Europe [Li et al., 2002] Example Analysis From One Model: Impact of a 20% Decrease in NA Anthropogenic NOx to EA Surface O3 (Jun 1 - Aug 31 2001) 0.5 0.0 -0.5 -1.0 -1.5 Mean of 10 ppb bins Change in ozone (ppbv) Each point is 1 daily max 8-hr avg surface O3 in 1 model grid cell MOZART-2 model at GFDL 0 20 40 60 80 100 120 Base case daily max 8-hr O3 (ppbv)
What Next? • JRC will distribute a visualization tool • Normalize by applied emissions perturbations • Examine seasonality of hemispheric transport of O3 • Impacts on deposition • Any obvious dependence on horizontal resolution? • Can we scale to reductions of different magnitude? • Contribution to O3 episodes, clean conditions, e.g. compare intercontinental contribution to O3 at the 10th, 50th, 90th percentiles of O3 distribution for a given season
Preliminary (!) Conclusions on HTAP Source-Receptor Relationships • Range of estimates narrows from that in the literature under a coherent modeling framework. • 20% decreases of NOx, NMVOC, CO individually in an HTAP region reduce annual mean surface O3 over receptor regions by <0.2 ppbv. -- Largest contributions from NOx everywhere, and European NMVOC • 20% reductions of NOx+NMVOC+CO in HTAP regions yield responses over the receptor regions that are ~20% of the decrease from equivalent reductions in domestic emissions. • 20% reductions in global CH4 abundances yield ~1 ppbv (0.7-1.8 range from individual models) decrease in annual mean surface O3 over HTAP receptor regions. • Reductions in individual O3 precursors appear to be fairly additive (to within 20-30%).