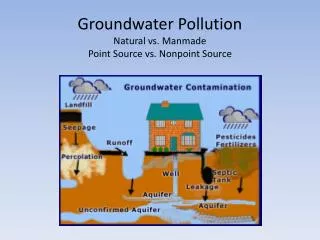
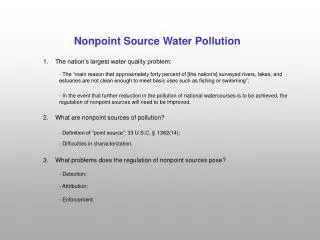
Nonpoint Source Pollution
Nonpoint Source Pollution. Some basic principles Example study of total pollution loads in the Corpus Christi Bay System rainfall-runoff relationship point and nonpoint source loads connection to bay water quality. Adapt Water to the Land System. Water Characterization

Nonpoint Source Pollution
E N D
Presentation Transcript
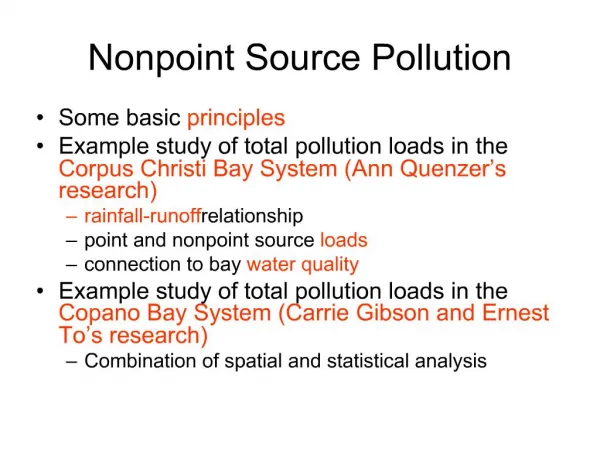
Nonpoint Source Pollution • Some basic principles • Example study of total pollution loads in the Corpus Christi Bay System • rainfall-runoff relationship • point and nonpoint source loads • connection to bay water quality
Adapt Water to the Land System • Water Characterization • (water yield, flooding, groundwater, pollution, sediment) Land Characterization (Land use, Soils, Climate, Terrain) Non Point Source Pollution (mean annual flows and pollutant loads)
Water Land Possible Land-Water Transform Coefficients
Expected Mean Concentration • EMC = Load Mass/Flow Volume either on a single event basis or as an annual average L Q C L(t)=Q(t)*C(t) T 0 0 T 0 T EMC =M/V Concentration Load Flow
Map-Based Surface Water Runoff Estimating the surface water yield by using a rainfall-runoff function Runoff, Q (mm/yr) Q P Runoff Coefficient C = Q/P Accumulated Runoff (cfs) Precipitation, P (mm/yr)
Water Quality: Pollution Loading Module Load [Mass/Time]=Runoff [Vol/Time]x Concentration [Mass/Vol] Precip. Runoff DEM LandUse Accumulated Load EMC Table Load Concentration
Expected Mean Concentration Land Use EMC Table derived from USGS water quality monitoring sites
Water Quality: Land Surface -Water Body Connection Bay Water Quality Total Constituent Loads Input for Water Quality Model
Readings on Nonpoint Source Pollution(Handbook of Hydrology on reserve in Engr Library) • Handbook of Hydrology: Sec 14.1 and 14.2 on nonpoint source pollution sources • Handbook of Hydrology: Sec 28.6 on design for water quality enhancement • Master’s theses of • Christine Dartiguenavehttp://www.crwr.utexas.edu/gis/gishyd98/library/dartig/rpt97_6.html • Ann Quenzerhttp://www.crwr.utexas.edu/gis/gishyd98/library/quenzer/rpt98_1.html • Patrice Melanconhttp://www.crwr.utexas.edu/crwr/reports/rpt99_3/rpt99_3.html • Katherine Osborne http://www.crwr.utexas.edu/crwr/reports/rpt00_10/rpt00_10.htm
Total Loads and Water Quality in the Corpus Christi Bay System Presented by: Ann Quenzer and Dr. David Maidment Special Thanks: Corpus Christi Bay National Estuary Program Ferdinand Hellweger Dr. Nabil Eid Dr. George Ward Dr. Neal Armstrong
Purpose • To determine the rainfall/runoff relationship • To estimate the point and non-point source loads to the bay system • To quantify the relationship between the total loads and the bay system water quality
Water Quality Total Loads Routing Point and Non-point Estimation Basic Concept Steady-State Model Linkage of the Two Models Calculate Flow and Total Loads
Watershed Delineation Sub-Watersheds
Precipitation Merged Precipitation Files Precipitation Trend Oregon State University over Bay System Precipitation Data = +
Mean Annual Runoff (mm/ yr ) Surface Water Runoff Land Use + Precipitation
Precipitation and Runoff Gradient Precipitation and Runoff Gradient from South (A) to North (B) along the Bay System Precipitation and Runoff Gradient Locations in the South (A) and North (B)
Runoff Into Each Bay System North Bay System 40.5 m3/s 56% of total flow Entire Bay System = 72 m3/s Middle Bay System 24.5 m3/s 34% of total flow South Bay System 7 m3/s 10% of total flow
Bay System Water Balance Entire Bay System
Bay System Water Balance North Bay System Middle Bay System South Bay System
Purpose • To estimate the point and non-point source loads to the bay system
Total Constituent Loading Land Surface Load Point Source Load Atmospheric Load ? Sediment Load ?
Land Surface Constituent Loading Load [Mass/Time]=Runoff [Vol/Time]xConcentration [Mass/Vol]
Land Use USGS Land Use (1970’s) Addition of Missing Land Use
Percent Land Use Total Study Area Legend
Point Sources Texas Natural Resources Conservation Commission (TNRCC) Water Quality Segmentation
Connection of Both Models Bay Water Quality Total Constituent Loads Input for Water Quality Model
Atmospheric Contribution Total Nitrogen Atmospheric Load to Land Surface = 2,700 Kg/d which is 35% of Land Surface Load from agricultural land use. This calculation is made assuming the EMC of 4.4 mg/l for agriculture and a Nitrogen concentration of 1.1 mg/l in precipitation
Bay System Segmentation Clipped Segmentation from Drs. Armstrong and Ward Segmentation Used in the CCBNEP Project
Water Quality Analysis Salinity Concentration and Mass Fluxes in Corpus Christi Bay. Finite Segment Analysis Flow of water Transport of Constituents Fluxes Loads Advection Dispersion
Observed vs. Expected Total Nitrogen (mg/l) Total Phosphorus (mg/l)
Observed vs. Expected Oil and Grease (mg/l) Copper (µg/l)
Observed vs. Expected Chromium (µg/l) Zinc (µg/l)
Conclusions • Strong South-North gradient in runoff from the land surface • Nearly all water evaporates from bays, little exchange with the Gulf • Nonpoint sources are main loading source for most constituents • Nitrogen, phosphorus, oil & grease loads are consistent with observed concentrations in the bays • Metals loads from land account for only a small part of observed concentrations in bays - a reservoir of metals in the bay sediments?