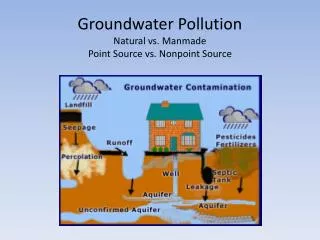
An open source version of the Nonpoint-Source Pollution and Erosion Comparison Tool
An open source version of the Nonpoint-Source Pollution and Erosion Comparison Tool. Climate Tools Café Webinar Dave Eslinger , Ph.D. 3 May, 2012. What is OpenNSPECT ?. Water quality screening tool Spatially distributed (raster-based) pollutant and sediment yield model

An open source version of the Nonpoint-Source Pollution and Erosion Comparison Tool
E N D
Presentation Transcript
An open source version of the Nonpoint-Source Pollution and Erosion Comparison Tool Climate Tools Café Webinar Dave Eslinger, Ph.D. 3 May, 2012
What is OpenNSPECT? • Water quality screening tool • Spatially distributed (raster-based) pollutant and sediment yield model • Compares the effects of different land cover and land use scenarios on total yields • User friendly graphical interface within a GIS environment
Processes Simulated • Topography determines flow direction and slope • Soil characteristics, land cover, andprecipitation determine runoff • Runoff, land cover, and pollutant coefficients determine pollutant loads • Runoff, topography, soil characteristics, and land coverdetermine sediment loads
Uses Existing Approaches • Rainfall runoff • Soil Conservation Service (SCS) curve number technique • Nonpoint pollutant • Event mean concentration technique • Sediment erosion • Universal Soil Loss Equation (USLE) • Modified (MUSLE) • Revised (RUSLE)
Assumptions/Limitations • Omitted processes • Stormwater drainage • Stream diversions • Snowmelt • Landslides • No time component for • Runoff dynamics • Sediment redeposition • Pollutant dynamics Source: NASA Earth Science Enterprise
Usage Example • Kingston Lake Watershed Association, near Conway, SC • Nutrient loads under different growth scenarios
Data Needs • National sources* • Land cover data • Topography • Precipitation • Soils data • Pollutant coefficients • Rainfall erosivity • Local sources • Water quality standards • Additional pollutant coefficients *Local “tuning” improves accuracy
Topography • Defines flow direction, stream networks, watersheds • Default • U.S. Geological Survey (USGS) 30 m resolution digital elevation model • Resolution impacts processing speed and file size
Land Cover • Foundation for runoff quantity, sediment yield, pollutant yield • Default • Coastal Change Analysis Program (C-CAP) • 30 m resolution • Flexible • Can easily substitute any land cover grid
Soils • Runoff and erosion estimates are dependent upon soils and land cover • Default • SSURGO soils† • County level resolution • Infiltration rate • Hydrologic group • Soil erodibility • K-factor † Soil Survey Geographic Database provided by the Natural Resources Conservation Service
Precipitation • Derived from point estimates or modeled • OSU PRISM data • Annual average • Single event rainfall
Pollutants • Pollutant coefficients • Event mean concentrations • Land cover specific • Defaults • Nitrogen • Phosphorus • Lead • Zinc • User–definable • New pollutants • New coefficients • Different criteria
Outputs • Runoff volume • Accumulated runoff • Sediment yield • Accumulated sediment load • Pollutant yield • Accumulated pollutant load • Pollutant concentration
Flow directions derived from topography Precipitation grid provides amount of rainfall Uses soils and land cover data to estimate volume of runoff Validated Baseline Runoff Flow direction
Estimates total annual sediment load delivered to coast Provides a conservative estimate A “worst-case” scenario Baseline Erosion
Baseline Nitrogen • Estimates total annual pollutant load delivered to coast • Focuses attention on source areas
Baseline Nitrogen • Estimates total annual pollutant concentration • Focuses attention on source areas
Example Application • Makaha Valley, Oahu, Hawaii • Annual time scale • “What-if” scenario • Baseline • Land cover change • New residential development • Climate change • Change in rainfall characteristics
Land Cover Change Scenario • Develop a subdivision • Change scrub/shrub vegetation to low intensity development
Nitrogen (Pre-Change) • Baseline • Low nitrogen runoff • Add scenario
Nitrogen (Post-Change) • Compare baseline estimate to the new estimated load • 138 percent increase in annual nitrogen load
Climate Change Scenarios • Same amount of rainfall, but change the number and intensity of the storms • 7 raining days, Type I • 14 raining days, Type IA • 3 raining days, Type II
Download OpenNSPECT: nspect.codeplex.com Esri 9.x version at csc.noaa.gov/nspect Project Contacts: Dave Eslinger, Project lead Dave.Eslinger@noaa.gov 843-740-1270 Shan Burkhalter Shan.Burkhalter@noaa.gov 843-740-1275 Matt Pendleton Matt.Pendleton@noaa.gov 843-740-1196 Questions?