Methylation Status of D4Z4 Repeat Elements in Controls Analyzed by Sodium Bisulfite Sequencing
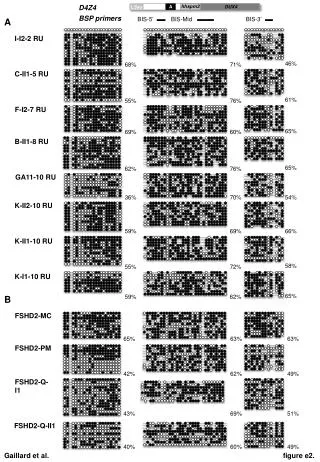
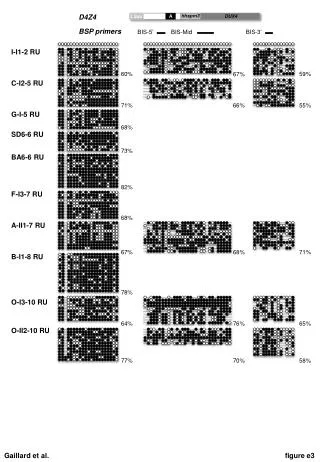
This study investigates the methylation status across the D4Z4 repeat region using sodium bisulfite sequencing in 7 control samples. We assess non-carrier and non-affected members of two families (C and D). The analysis distinguishes three regions: BIS-5’, BIS-Mid, and BIS-3’. Each row displays cloned DNA molecules with black dots indicating methylated CpG sites and white dots representing unmethylated sites. The percentages of methylated CpGs are detailed below each sample, contributing to our understanding of methylation variability in healthy individuals.

Methylation Status of D4Z4 Repeat Elements in Controls Analyzed by Sodium Bisulfite Sequencing
E N D
Presentation Transcript
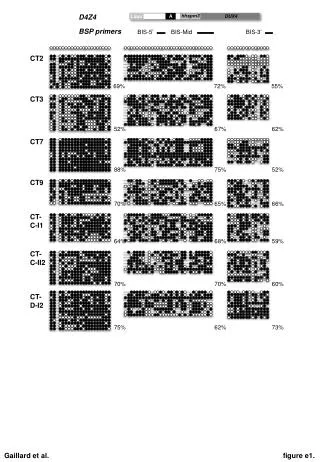
* BIS-Mid BSP primers BIS-5’ BIS-3’ CT2 75% 70% 64% 70% 52% 88% 69% 75% 68% 70% 65% 62% 72% 67% 73% 60% 59% 66% 52% 62% 55% CT3 CT7 D4Z4 hhspm3 DUX4 LSau A CT9 CT-C-I1 CT-C-II2 CT-D-I2 Gaillard et al. figure e1.
Figure e-1: Methylation status across the D4Z4 repeat by sodium bisulfite sequencing in controls. For controls, 7 samples were analyzed. Samples CT-C-I1; CT-C-II2 are non-carrier non-affected members of family C and CT-D-I2 of family D (table e4). The position of the three different regions analyzed within D4Z4 is indicated above the corresponding column (from left to right, BIS-5’; Middle, BIS-Mid and right, BIS-3’). Each row of dots corresponds to a cloned DNA molecule. Black dots correspond to methylated CpG, white dots to unmethylatedCpGs and absence of dot represents sequence variation compared to the reference sequence. The percentage of methylated CpG among all CpGs/individual analyzed is given below each sample.