Download
1 / 9

E N D
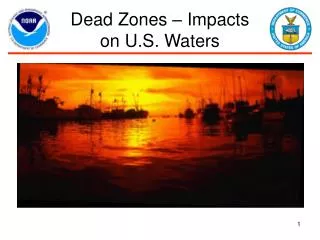
Coastal Dead Zones Inquiry: Images and Observations
Image 1. Global map (A) of cumulative human impact across 20 ocean ecosystem types. (Insets) Highly impacted regions in the Eastern Caribbean (B), the North Sea (C), and the Japanese waters (D) and one of the least impacted regions, in northern Australia and the Torres Strait (E). http://www.sciencemag.org/cgi/content/full/319/5865/948/FIG1
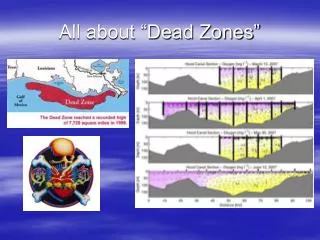
Role of Data Explanation 1 • Compare different locations to determine relative human impact worldwide. • Use data to inform conservation efforts to protect sensitive areas. • Heavily impacted ocean occurs in the North Sea, the South and East China Seas, and the Bering Sea. Much of the coastal area of Europe, North America, the Caribbean, China and Southeast Asia are also heavily impacted. • The least impacted areas are mostly near the poles, but also appear along the north coast of Australia, and small, scattered locations along the coasts of South America, Africa, Indonesia and in the tropical Pacific. http://www.sciencemag.org/cgi/content/full/319/5865/948/FIG1
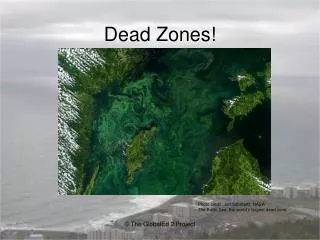
Explanation 4 • The Sea-viewing Wide Field-of-view Sensor (SeaWiFS) can not see the bottom of the ocean, it can see the surface, where sediments from rivers mix with ocean waters. • The images shown here are SeaWiFS observations of the Mississippi River delta, the Yangtze River mouth in China (The Yangtze River mouth is not currently identified as an area with an associated dead zone, but such conditions could develop there in the future), and the Pearl River mouth in China, near Hong Kong. • The "creeping dead zones" are areas in the ocean where it appears that phytoplankton productivity has been enhanced, or natural water flow has been restricted, leading to increasing bottom water anoxia.
Image 2 http://blog.nola.com/graphics/deadzone_how061007.gif
Explanation 2 http://blog.nola.com/graphics/deadzone_how061007.gif
Image 3 http://blog.nola.com/graphics/deadzone_how061007.gif
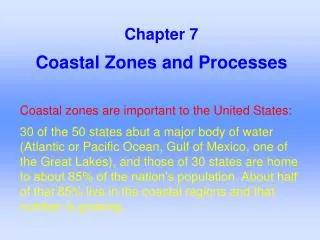
Explanation 3 • Compare the 2005 and 2006 dead zones in the Gulf of Mexico. • Describe the trends you see from 1985-2006 in dead zone areas.