Download
1 / 1
10 likes | 96 Vues
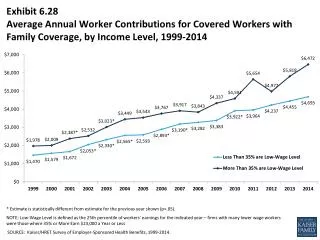
Explore average annual worker contributions for covered workers with family coverage based on income levels from 1999 to 2014. Discover how contributions varied across different income brackets and the significance of these findings.

E N D
Exhibit 6.28Average Annual Worker Contributions for Covered Workers with Family Coverage, by Income Level, 1999-2014 * Estimate is statistically different from estimate for the previous year shown (p<.05). NOTE: Low-Wage Level is defined as the 25th percentile of workers’ earnings for the indicated year – firms with many lower wage workers were those where 35% or More Earn $23,000 a Year or Less SOURCE: Kaiser/HRET Survey of Employer-Sponsored Health Benefits, 1999-2014.