Advanced Interval Views for Microarray Time-course Data Analysis
10 likes | 89 Vues
Explore the Time-series Explorer tool through an extensive user evaluation with experienced biologists, revealing unique insights and advantages over established techniques in analyzing microarray time-course data. Discover new patterns of temporal activity with this innovative tool.

Advanced Interval Views for Microarray Time-course Data Analysis
E N D
Presentation Transcript
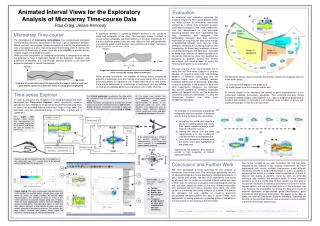
Animated Interval Views for the Exploratory Analysis of Microarray Time-course Data Evaluation An extensive user evaluation assessed the practical utility of the Time-series Explorer within the wider context of microarray time-series analysis as a whole. This evaluation involved experienced biologists (who were independent from the development of the technique) analyzing familiar data from experiments that they themselves had designed. The participating biologists also had extensive experience of analyzing their data using a range of established software tools such as Time-Searcher, Hierarchical Clustering Explorer and GeneSpring. As these tools implement a range of existing techniques and have been evaluated as being most effective at revealing patterns in microarray time-course data, this qualified the biologists to properly assess the relative advantages and disadvantages of using the Time-series Explorer as an alternative. The main outcome of our user evaluation was to verify that the Time-series Explorer is uniquely capable of revealing previously unsuspected patterns of temporal activity and that the patterns found were of sufficient relevant biological significance to encourage a biologist to use the technique in the analysis of data from other experiments. Moreover, the technique also proved capable of revealing suspected patterns of temporal activity and the evaluation uncovered significant advantages in using the Time-series Explorer over other more established techniques. Paul Craig, Jessie Kennedy Microarray Time-course A significant obstacle to achieving effective analysis is the combined scale and complexity of the data. This inevitably makes it difficult to reveal certain biologically significant patterns in the data. In particular it is the less dominant patterns that are more difficult to find and, specifically, unsuspected patterns with features that combine over smaller intervals of an experiment’s overall time-frame. The development of microarray technologies has revolutionized biological and biomedical research, specifically in the area of gene expression analysis. Where previous technologies allowed biologists to monitor the expression of only a few genes at a time, microarray experiments allow them to monitor the expression of thousands of genes (normally around 8,000) in parallel across multiple stages of a biological process. While this new perspective on biological functioning is recognised as having the potential to have a significant impact on the diagnosis, treatment, and prevention of diseases, it is only through effective analysis of the data that biologists can begin to unlock this potential. A significant pattern occurring exclusively over an interval (P) that would not be revealed by existing analysis techniques. While existing techniques are capable of finding either unexpected patterns of expression over the majority of an experiment’s time frame or expected patterns of expression over smaller intervals of the time frame, there are no techniques, or combination of techniques, that are suitable for finding unsuspected patterns of expression over smaller intervals. • Animating the scatter-plot to reveal general trends in activity for all genes over the entire time course: • Clicking and dragging on the graph view • static frames from the animated scatter-plot. • At various stages of the animation the spread of gene representations in the scatter-plot became horizontally elongated. This occurred primarily during transitions between stages of development (i.e. virgin to pregnancy, pregnancy to lactation and lactation to involution) and indicated large numbers of genes with significant changes in their level of expression. Graph plot of rescaled microarray time-course data: the range of values at each time point defines a grey area and the time-series of a single gene is highlighted. Time-series Explorer As the graph view controls are manipulated and the selected interval is adjusted, single point representations of genes in the scatter-plot glide to their new positions. This allows the user to quickly relate between different interval scatter-plot views and gain an animated overview of their data. The interval scatter-plot summarizes the data within the selected interval (P). representing each gene as a single point: Y-axis translation corresponds to change from normal expression over the selected interval (I.e. high or low) X-axis translation corresponds to change in expression from the first time point to the second (rising or falling) In order to overcome the limitations of existing techniques we have developed the Time-series Explorer, which specifically supports biologists in their attempts to reveal temporal patterns by allowing them to control an animated interval scatter-plot view of their data. The technique uses two coordinated views of the data: a graph and a scatter-plot. • An example of a previously unexpected biologically significant pattern of temporal activity found during our user-evaluation. • Animating the scatter-plot reveals a group of outlying genes with rising then falling expression over a small interval of the time course, • moving the mouse over the gene representations in the scatter-plot view allows them to be labelled and • have their expression patterns over the entire time-frame highlighted in the graph view. • Significantly the selection was found to contain a high proportion of Keratin associated genes. The graph view overlays value versus time representations of the rescaled expression for all genes and allows the user to specify an interval (P). If the selected interval is shifted in the positive direction, gene representations in the scatter-plot move smoothly in a predictable anticlockwise rotation. Patterns can be investigated further by selecting genes in the scatter-plot view. This causes them to be labelled and/or highlighted in the graph view. Conclusion and Further Work Due to the success of our user evaluation the tool has been adopted for the analysis of two ongoing experiments. As these experiments will involve multiple time-courses under different conditions, we plan to adapt the technique so that it is capable of comparing the results of multiple related experiments. In order to improve the quality of patterns found by such an extended technique and increase the biologists ability to make informed decisions as to the significance of their results, we also plan to incorporate measures of statistical confidence into both the visual representations and interaction mechanisms of the technique, and thus increase the possibilities for linking the data and results to external databases of pre-defined gene classifications, gene annotations and pathway information. We expect to be able to adapt the existing Time-series Explorer technique, exploiting the benefits of the animated interval view to develop a more complete microarray time-series analysis tool. We have developed a novel technique for the analysis of microarray time-course data. This technique specifically focuses on allowing biologists to reveal previously unsuspected patterns of gene activity over smaller intervals of an experiments time frame by allowing them to control an animated interval scatter-plot view of their data. An extensive evaluation, involving biologists working with real data, tested the extent of the tools desired functionality and assessed the technique’s practical utility within the wider context of microarray time-series analysis as a whole. This proved the technique not only capable of revealing previously unsuspected temporal patterns but also, in certain cases, more appropriate for finding previously suspected patterns and patterns that occurred over the majority of the time-frame. • Screen-shot of the Time-series Explorer interface: • Toolbar • Graph view • Scatter-plot • Selected gene list • Tree-pane grouping panel (to store gene classifications and user selections) Colour coding: The scale used (ranges from dark-blue, for small numbers of overlaid genes, through blue, cyan and green to yellow for larger numbers of overlaid gene representations. This attempts to utilize as much of the visible spectrum as possible without using reds or greys, which are more appropriately used to represent highlighted and deselected genes. The ordering of colours is such that light colours represent a high density of genes and dark colours represent a low density of genes. This ensures that dark colours surround light colours, which would be otherwise hard to distinguish from the background. Contact e-mail: p.craig@napier.ac.ukWebPages: http://www.soc.napier.ac.uk/TSExplorer