Download
1 / 15
150 likes | 238 Vues
Understand the California ISO Duck Chart (2012-2020), addressing issues such as potential over-generation using solutions like demand response, energy storage, and curtailment. Learn about flattening the duck into a halibut with backup slides.

E N D
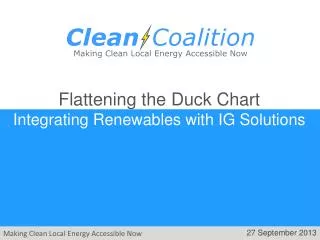
Flattening the Duck Chart Integrating Renewables with IG Solutions 27 September 2013
CAISO Duck Chart (2020 vs. 2013) Highest net load: 25,000 MW at 8pm Lowest net load: 11,700 MW around 1pm
CAISO Duck Chart (2020 Issues) 13,100 MW 5-8pm 5,300 MW 8-11am Potential over-generation
Addressing the Duck Chart with Import/Export Import/Export
Addressing the Duck Chart with Demand Response Demand Response
Addressing the Duck Chart with Energy Storage Energy Storage
Addressing the Duck Chart with Curtailment Curtailment
Back-up Slides 27 September 2013