Download
1 / 51
510 likes | 634 Vues
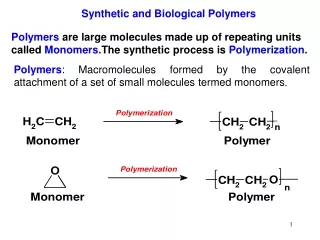
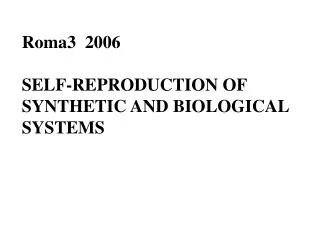
Roma3 2006 SELF-REPRODUCTION OF SYNTHETIC AND BIOLOGICAL SYSTEMS. THE INCREASE OF COMPLEXITY TOWARDS THE EMERGENCE OF LIFE PROCEEDS VIA THE INTERPLAY BETWEEN SELF-ORGANIZATION AND EMERGENCE.

E N D
Roma3 2006 SELF-REPRODUCTION OF SYNTHETIC AND BIOLOGICAL SYSTEMS
THE INCREASE OF COMPLEXITY TOWARDS THE EMERGENCE OF LIFE PROCEEDS VIA THE INTERPLAY BETWEEN SELF-ORGANIZATION AND EMERGENCE
SELF-ORGANIZATION: THE ACQUISITION OF HIGHER STRUCTURAL ORDER-AS DETERMINED BY THE SYSTEM’S RULES …under thermodynamic or kinetic control
Emergence: the formation of a higher complexity level brings about NOVEL properties that are not present in the basic components ..the whole is more than the sum of the parts ...holism
pairing of chromsomes and crossing over of chromosomes does occur pairing of chromsomes does not occur chromosome pairs align at metaphase plate chromosome align independently Comparison of meiosis and mitosis. (The blue chromosomes were inherited from one parent, and the red chromosomes were inherited from other parent.) homologous chromosomes separate daughter chromosomes separate daughter chromosomes separate daughter cells are not genetically identical to parent cells daughter cells are genetically identical to parent cells (from Biology / S.Mader, 5th ed.)
A-DNA B-DNA Z-DNA
Original parent molecule First generation daughter molecules Second generation daughter molecules Schematic diagram of semiconservative replication. Parental DNA is shown in green and newly synthesized DNA in red. [After M. Meselson and F.W. Stahl. Proc. Nat. Acad. Sci. 44(1958):671.)
0.34nm 3.4nm 2nm DNA Double Helix ________________________ Sugar: Deoxyribose Bases: Adenine (A), guanine (G) thymine (T), cytosine (C) Strands: Double stranded with base pairing sugar-phosphate backbone complementary base pairing hydrogen bonds sugar
parent molecule new strand old strand old strand new strand daughter molecule daughter molecule
In particular research focusses on SELF-REPLICATION SYSTEMS Self means that the process is spontaneous, i.e., determined by the internal rule of the system (generally self-replication corresponds to autocatalysis, and generally the time process is exponential) A 2A 4A 8A 16A etc
THE NON LINEARITY In self-replication mechanisms (how it works on paper) a) heterocatalysis A B One molecule per second, then 6.1023 sec. to make one mole of B b) self-replication (autocatalysis) A A Only 79 sec. to make one mole of A 2.....4.....8.....16.....32.....64.....128......etc.
THE FORMOSE REACTION AS AN AUTOCATALYTIC PROCESS TO MAKE SUGARS?.... IMPORTANCE FOR THE PREBIOTIC RNA-WORLD? CHI VUOLE FARE UN BREVE STUDIO SULLA „FORMOSE REACTION“ E RIFERIRE IN CLASSE? ..USING GOOGLE...
0.34nm 3.4nm 2nm DNA Double Helix ________________________ Sugar: Deoxyribose Bases: Adenine (A), guanine (G) thymine (T), cytosine (C) Strands: Double stranded with base pairing sugar-phosphate backbone complementary base pairing hydrogen bonds sugar
A B K 1 T ( 2 x ) M K 2 k D General mechanism for a minimal self-replicating system. 2 A A Constituent represents the activated form of trimer here. Large arrowheads at the reaction arrows for the reversible reactions indicate the favored site of the equilibrium. G. Von Kiedrowski, Angew.chem. (1986) 10 , 932 Rebek, JACS (1990)
Also some peptides can self-replicate.... Ghadiri, 2001
the notion of hypercycle, originally developed by Eigen and collaborators (Eigen 1971, Eigen and Schuster 1977, 1979). A simple rendering of an hypercycle,
Self-reproduction of supramolecualr aggregates p.s. reproduction and replication are not the same thing...
Micelle Liposome Bilayer sheet Cross-sectional views of the three structures that can be formed by mechanically dispersing a suspension of phospholipids in aqueous solution The red circles depict the hydrophilic heads of phospholipids, and the squiggly lines (in the yellow region) the hydrophobic tails.
waterpool H O 2 bulk solvent A , B S S S S S S S S B S B S S A A S S A B S + S S B S A S S S B A S S S S S S S S S S S S S S S S B S B S A S A S S A B + S S S S S S S S S S A S S B S S B S S S S B A B S S S S S S S S S A A S S S S S S S S S A B S + S S S S B S A S S S B S S S S S S A S S S S S S S S B S S S S B S S S A S A S S A B + S S S S A B S B S A S S S S S S S S SELF - REPLICATING MICELLES a b etc. etc. LUISI & VARELA ORIGIN OF LIFE 1990
The hydrophobicity of the lipid bilayer Is the main driving force for The activity/reactivity and applications Of liposomes
S S S S S S S S S S S S S S S S S S S S S S S forming more of smaller stable vesicles S S S S S S S S S H H H O O O S S S 2 2 2 S S S S S S S S S S S S H O 2 s-s water-insoluble surfactant precursor excess bound to the bilayer H O 2 hydrolyzed lipophilic bilayer of surfactant S on / by the bilayer s-s larger unstable intermediates
A B • Cryo-TEM micrographs of • ferritin -containing POPC liposomes prepared using the reverse phase evaporation method, followed by a sizing down by extrusion through polycarbonate membranes with 100 nm pore diameters ([POPC] = 6.1 mM); and of • the vesicle suspension obtained after addition of oleate to preformed POPC liposomes ([POPC] = 3 mM, [oleic acid + oleate] = 3 mM). Nathalie Berclaz, J. Phys. Chem. B 2001, 105, 1065-1071
Schematic Representation of the Possible Vesicle Formation and Transformation Processes if Oleate (and Oleic Acid) Are Added to Preformed Vesicles Which Have Been Labelled with a Water-Soluble Marker • shows the situation if only de novo vesicle formation occurs. • illustrates a growth in size of the preformed and labelled vesicles which may lead to a splitting (fission process), either yielding vesicles which all contain marker molecules (case a, a statistical redistribution of the ferritin molecules is thus obtained) or yielding vesicles which do not all contain markers (case b). See text for details. (I) de novo vesicle formation oleate (and oleic acid) (II) growth of the preformed vesicles eventually followed by a fission process oleate (and oleic acid) a b J. Phys. Chem. B 2001, 105, No. 5, 1056-1064
Separation of nonentrapped ferritin molecules from ferritin-containing POPC vesicles using a Sepharose 4B column (length 50 cm, diameter 1.2 cm). The POPC vesicles were prepared in borate buffer (0.1 M, pH 8.5) by the reverse phase evaporation method, followed by a sizing down to about 100 nm by extrusion. The vesicle suspension applied onto the column had a volume of 0.45 mL, and fractions of 1 mL were collected. The open squares represent the POPC, and the filled circles represent the ferritin concentrations. J. Phys. Chem. B 2001, 105, No. 5, 1056-1064
Number-weighted size distributions as obtained by cryo-TEM • for the preformed POPC vesicles ([POPC] ) 1.9 mM) and • for the vesicle suspension obtained upon addition of oleate to preformed ferritin-containing POPC vesicles ([POPC] ) 0.2 mM, [oleic acid + oleate] ) 5 mM). Empty (empty bars) and ferritin-containing (filled bars) vesicles are represented individually in the histogram. • Direct comparison of the number-weighted size distribution of the preformed POPC vesicles which contained at least one ferritin molecule (filled bars) with the number-weighted size distribution of the ferritin-containing vesicles obtained after oleate addition to preformed POPC vesicles (empty bars). Note that the total of all ferritin-containing vesicles was set to 100%. filled bars: liposomes with ferritin empty bars: empty liposomes J. Phys. Chem. B 2001, 105, No. 5, 1056-1064
Number-weighted size distribution as obtained by cryo-TEM for the oleic acid vesicle suspension analyzed before hydrolysis (filled bars) and after oleic anhydride hydrolysis (empty bars). • (B) Number-weighted size distribution as obtained by cryo-TEM for the oleic acid vesicle suspension examined after oleic anhydride hydrolysis. Empty (empty bars) and ferritin-containing (filled bars) vesicles are represented individually. • (C) Comparison of the number-weighted size distribution of the filled oleic acid vesicles obtained before (filled bars) and after (empty bars) oleic anhydride hydrolysis. The total of all ferritin-containing vesicles was set to 100%. The last bar of the histogram in the three figures corresponds to all the vesicles larger than 300 nm. filled bars: liposomes with ferritin empty bars: empty liposomes Nathalie Berclaz et al., Nathalie J. Phys. Chem. B 2001, 105, No. 5, 1056-1064
A B • Comparison of the “absolute” number-weighted size distribution • of the empty and • of the filled preformed POPC liposomes ([POPC] = 6.1 mM; black bars) with the vesicles obtained after addition of oleate ([POPC] = 3 mM, [oleic acid + oleate] = 3 mM; empty bars). J. Phys. Chem. B 2001, 105, 1065-1071