1. Expected sales/expenses
110 likes | 278 Vues
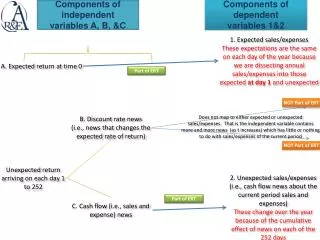
Components of independent variables A, B, &C. Components of dependent variables 1&2. 1. Expected sales/expenses These expectations are the same on each day of the year because we are dissecting annual sales/expenses into those expected at day 1 and unexpected. A. Expected return at time 0.

1. Expected sales/expenses
E N D
Presentation Transcript
Components of independent variablesA, B, &C Components of dependent variables 1&2 1. Expected sales/expenses These expectations are the same on each day of the year because we are dissecting annual sales/expenses into those expected at day 1 and unexpected A. Expected return at time 0 Part of ERT NOT Part of ERT Does not map to either expected or unexpected sales/expenses. That is the independent variable contains more and more news (as t increases) which has little or nothing to do with sales/expenses of the current period B. Discount rate news (i.e., news that changes the expected rate of return) NOT Part of ERT Unexpected return arriving on each day 1 to 252 Part of ERT 2. Unexpected sales/expenses (i.e., cash flow news about the current period sales and expenses) These change over the year because of the cumulative effect of news on each of the 252 days C. Cash flow (i.e., sales and expense) news
Components of independent variablesA, B, &C Components of dependent variables 1&2 1. Expected sales/expenses These expectations are the same on each day of the year because we are dissecting annual sales/expenses into those expected at day 1 and unexpected A. Expected return at time 0 Part of ERT Sadka JAR. 2007 shows that cash flow news is the predominant news component of returns NOT Part of ERT Does not map to either expected or unexpected sales/expenses. That is the independent variable contains more and more news (as t increases) which has little or nothing to do with sales/expenses of the current period B. Discount rate news (i.e., news that changes the expected rate of return) NOT Part of ERT Unexpected return arriving on each day 1 to 252 Part of ERT 2. Unexpected sales/expenses (i.e., cash flow news about the current period sales and expenses) These change over the year because of the cumulative effect of news on each of the 252 days C. Cash flow (i.e., sales and expense) news
Using the notation from the previous slide, I believe dependent variable/daily return coefficient on a given day, τ, can be dissected (by definition) as follows: In order to facilitate a tractable analysis, I will assume that a given day, τ, the expected return component and the unexpected (i.e., cash flow news plus discount rate news) are independent, such that:
Components of independent variablesA, B, &C Components of dependent variable 1 1. Expected sales/expenses These expectations are the same on each day of the year because we are dissecting annual sales/expenses into those expected at day 1 and unexpected A. Expected return at time 0 Part of ERT Sadka JAR. 2007 shows that cash flow news is the predominant news component of returns Minor effect in our analyses NOT Part of ERT Does not map to either expected or unexpected sales/expenses. That is the independent variable contains more and more news (as t increases) which has little or nothing to do with sales/expenses of the current period B. Discount rate news (i.e., news that changes the expected rate of return) (1)The effect of news accumulates over time such that less and less of daily returns are related to the dependent variables . (2) Mapping declines over the year because more of daily returns are not related to expected sales/expenses. (3) Non-zero end of year coefficient reflects expectations that remain at the end of the year. (4) Daily returns contain little of expected returns when news is bad because expected returns must be positive. Unexpected return arriving on each day 1 to 252 NO mapping to expected sales/expenses C. Cash flow (i.e., sales and expense) news
Expected dependent variable/daily return coefficient: • If I understand it correctly, then we are arguing that is decreasing over the fiscal year (i.e., decreasing with τ) because: • …assuming “expected return at time 0” is the same across all days of the fiscal year. • …assuming “expected return at time 0” is the same across all days of the fiscal year. • ”Mapping declines over the year because more of daily returns are not related to expected sales/expenses.”
Components of independent variablesA, B, &C Conditional on sign of news Components of dependent variable 1 1. Expected sales/expenses These expectations are the same on each day of the year because we are dissecting annual sales/expenses into those expected at day 1 and unexpected A. Expected return at time 0 Part of ERT Sadka JAR. 2007 shows that cash flow news is the predominant news component of returns Minor effect in our analyses NOT Part of ERT Does not map to either expected or unexpected sales/expenses. That is the independent variable contains more and more news (as t increases) which has little or nothing to do with sales/expenses of the current period B. Discount rate news (i.e., news that changes the expected rate of return) Now we are have 2 expectations: (1) if news is turns out to be good and(2) if news turns out to be bad; the idea is along the lines that we expect to sell more ice cream if the summer is hot but we still expect to sell some ice cream if the summer is cool (different expectations according to different conditions). Now there is a mapping to expected sales/expenses Unexpected return arriving on each day 1 to 252 C. Cash flow (i.e., sales and expense) news
Expected dependent variable/daily return coefficient: Variance may also vary with sign (this is P&T’s point and we control for this???) Sadka JAR. 2007 shows that cash flow news is the predominant component of returns • If I understand it correctly, then we are arguing that is decreasing over the fiscal year (i.e., decreasing with τ) because: • …assuming “expected return at time 0” is the same across all days of the fiscal year. • …assuming “expected return at time 0” is the same across all days of the fiscal year. • ”Mapping declines over the year because more of daily returns are not related to expected sales/expenses.”
Expected Sales revenue • Sales revenue of the current year less responsive to bad news than good news; we expect more beer will be drunk if the summer turns out to be hot than if the summer turns out to be cold • Expected Current Sales element of expenses • Similar response for each sub-sample because matched expenses are very difficult to change in the short run; we still have to pay rent and up-keep on the pub • Expected Expectations element of expenses • Much higher if the news is bad; e.g., expected write downs are much higher if news is bad….more likely to have to close the pub
Components of independent variablesA, B, &C Components of dependent variable 2 (1) Coefficient declines over time because the number of days within the year to which the news relates declines form 252 to 0. (2) Non-zero end of year coefficient reflects changes in expectations about sales and expenses in in future years. Sadka JAR. 2007 shows that cash flow news is the predominant news component of returns Minor effect in our analyses Does not map to either expected or unexpected sales/expenses. That is the independent variable contains more and more news (as t increases) which has little or nothing to do with sales/expenses of the current period B. Discount rate news (i.e., news that changes the expected rate of return) NOT Part of ERT Unexpected return arriving on each day 1 to 252 Part of ERT 2. Unexpected sales/expenses (i.e., cash flow news about the current period sales and expenses) These change over the year because of the cumulative effect of news on each of the 252 days C. Cash flow (i.e., sales and expense) news
Unexpected dependent variable/daily return coefficient: • For this unexpected coefficient, we are arguing that is decreasing over the fiscal year (i.e., decreasing with τ) because: • “…because the number of days within the year to which the news relates declines form 252 to 0.” • …assuming “expected return at time 0” is the same across all days of the fiscal year. • ”Mapping declines over the year because more of daily returns are not related to expected sales/expenses.”
Unexpected Sales revenue • No difference across samples • Unexpected Current Sales element of expenses • No difference across samples • Unexpected Expectations element of expenses • Much higher if the news is bad; e.g., expected write downs are much higher if news is bad