Download
1 / 37
370 likes | 640 Vues
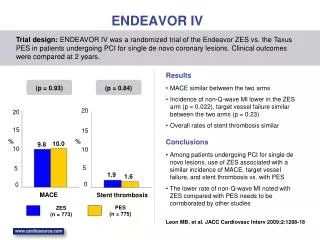
ENDEAVOR IV. Three-Year Follow-up from a Prospective Randomized Trial Comparing a Zotarolimus-Eluting Stent and a Paclitaxel-Eluting Stent in Patients with Coronary Artery Disease. Martin B. Leon, MD for the Endeavor IV investigators. Columbia University Medical Center

E N D
ENDEAVOR IV Three-Year Follow-up from a Prospective Randomized Trial Comparing a Zotarolimus-Eluting Stent and a Paclitaxel-Eluting Stent in Patients with Coronary Artery Disease Martin B. Leon, MD for the Endeavor IV investigators Columbia University Medical Center Cardiovascular Research Foundation New York City Monday, September 22, 2009
ENDEAVOR IV – 3yr FU Clinical Trial Design PIs: Martin B. Leon and David E Kandzari Single De Novo Native Coronary Lesion Vessel Diameter: 2.5–3.5 mm Lesion Length: ≤ 27 mm Pre-dilatation required 1:1 randomization N = 1,548 patients 80 sites US Endeavor Stent n = 774 Taxus Stent n = 774 Clinical/MACE 30d 6mo 8mo 9mo 12mo 2yr 3yr 4yr 5yr Angiography/IVUS QCA and IVUS Subset(328 total = 21.2%) Primary Endpoint: TVF at 9 months Secondary Endpoints: In-segment % DS at 8 months; TLR and TVR at 9 months Drug Therapy: ASA and Clopidogrel/Ticlid ≥6 months Zotarolimus Dose: 10 g per mm stent length
Patients Enrolled N = 1548 Randomized Taxus n = 775 Endeavor n = 773 Clinical F/U (12 mo) 756/773 97.8% Clinical F/U (12 mo) 757/775 97.7% Clinical F/U (36 mo) 734/773 95.0% Clinical F/U (36 mo) 734/775 94.7% ENDEAVOR IV – 3yr FUPatient Flow Chart
Endeavor Taxus ENDEAVOR IV – 3yr FUTVF to 36 months 3-year HR 0.77 [0.58, 0.99] P = 0.049 20% 1-year HR 0.79 [0.56, 1.11] P=0.166 15.9% 15% ∆3.6% 9.6% 12.3% 10% Cumulative Incidence for TVF 7.7% 5% ∆1.9% 0% 0 90 180 270 360 450 540 630 720 810 900 990 1080 Time after Initial Procedure (days) Values are the KM estimatesP values were calculated by Log Rank Test
Endeavor (n=734) RRR 23% NNT: 27 P=0.052 Taxus (n=734) RRR 48% NNT: 29 P=0.005 ENDEAVOR IV – 3yr FUPrimary EP TVF to 36 months P =0.608 Rate 91/734 118/734 27/734 52/734 73/734 80/734 TVF = Cardiac Death/MI + TVR Values are the event rates P values were calculated by Fisher Exact Test
Endeavor Taxus ENDEAVOR IV – 3yr FUCD/MI to 36 months 3-year HR 0.52 [0.32, 0.82] P = 0.004 10% 1-year HR 0.66 [0.35, 1.25] P=0.201 ∆1.0% 8% 7.1% 6% Cumulative Incidence ofCardiac Death/MI ∆3.5% 3.1% 4% 2% 3.6% 2.1% 0% 0 90 180 270 360 450 540 630 720 810 900 990 1080 Time after Initial Procedure (days) Values are the KM estimatesP values were calculated by Log Rank Test
Endeavor 1-3 year HR 0.43 [0.22, 0.84] Taxus 1-year HR 0.66 [0.35, 1.25] 4.0% 3.1% ∆2.3% ∆1.0% P=0.201 P = 0.012 2.1% 1.7% ENDEAVOR IV – 3yr FUCD/MI Landmark to 36 months 6.0% 4.0% CD/MI (%) 2.0% 0.0% 0 90 180 270 360 450 540 630 720 810 900 990 1080 Time after Initial Procedure (days) Values are the KM estimatesP values were calculated by Log Rank Test
1 year HR 0.60 [0.29, 1.23] 1-3 year HR 0.31 [0.12, 0.86] Endeavor Taxus 2.6% 2.3% ∆1.0% P=0.154 1.6% ∆1.6% P = 0.017 0.7% ENDEAVOR IV – 3yr FUMI Landmark to36 months 3.0% 2.0% MI (%) 1.0% 0.0% 0 90 180 270 360 450 540 630 720 810 900 990 1080 Time after Initial Procedure (days) Values are the KM estimatesP values were calculated by Log Rank Test
Endeavor Taxus ENDEAVOR IV – 3yr FUAll MIs CKMB Rises (xULN) 1-3 years 10/16 (63%) of Taxus MIs with CKMB rises 10X ULN Number Patients ≥10X ≥5X<8X ≥8X<10X 2/4 Endeavor MIs and 2/16 Taxus MIs CKMB (xULN) <5X
ENDEAVOR IV – 3yr FUDAPT to 36 months* * Physicians and patients unblinded at 12 months
Endeavor (n=734) Taxus (n=734) ENDEAVOR IV – 3yr FUARC VLST 12-36 mos P =0.006 RRR 91% NNT: 71 P=0.006 P =0.124 P =0.062 Rate n=1 n=6 n=5 n=11 n=1 ARC Definite Probable ARC Definite ARC Probable Values are the event rates P values were calculated by Fisher Exact Test
Endeavor Taxus 360 450 540 630 720 810 900 990 1080 ENDEAVOR IV – 3yr FUARC ST Def/Prob 12-36 mos (VLST) 4% 1-3 year HR 0.09 [0.01, 0.71] P = 0.004 Cumulative Incidence of Def/Prob Thrombosis 2% 1.6% ∆1.5% 0.1% 0% Time after Initial Procedure (days) Values are the KM estimatesP values were calculated by Log Rank Test
1024 949 878 838 835 697 Taxus VLST ( n=11) 5/11 On ASA and Plavix 4/11 on ASA 2/11 No DAPT 2/11 Resulted in a TLR 9/11 Resulted in an AMI 689 645 619 495 413 369 Endeavor VLST ( n=1) 1/1 No DAPT 1/1 Resulted in an AMI ENDEAVOR IV – 3yr FUTiming of ARC Def/Prob VLST 5 Taxus VLST events from 2-3 years Taxus Endeavor 360 480 600 720 840 960 1080 Days
Endeavor Taxus ENDEAVOR IV – 3yr FUTLR to 36 months 3-year HR 1.10 [0.73, 1.65] P = 0.662 10% 1-year HR 1.36 [0.81, 2.28] P=0.239 8% 6.5% 6% 4.5% 6.1% Cumulative Incidence for TLR 4% ∆0.4% 3.3% 2% ∆1.2% 0% 0 90 180 270 360 450 540 630 720 810 900 990 1080 Time after Initial Procedure (days) Values are the KM estimatesP values were calculated by Log Rank Test
44% Increase 82% Increase 6.5% 6.0% 5.9% 4.5% 4.5% 3.3% ENDEAVOR IV – 3yr FUTLR Rate Over Time Taxus(Yr 3 N = 734/775) Endeavor(Yr 3 N = 734/773) TLR Rate 1 2 3 1 2 3 Years of Follow-up Years of Follow-up Values are the event rates
106% Increase 27% Increase 9.1 7.8 7.5 7.2 7.2 6.9 6.5 5.9 5.6 4.4 Endeavor II and Taxus IV: DES Arms TLR Rates to 5 years ENDEAVOR II(n=577/598) TAXUS IV(n=618/662) TLR (%) TLR (%) 1 2 3 4 5 1 2 3 4 5 Years of Follow-up Years of Follow-up 5 Year Clinical Results of TAXUS IV, Stone, ACC 2007 Results come from separate clinical trials. Data may differ in a head-to-head comparison.
Subgroup Post-Hoc Analysis ENDEAVOR IV
ENDEAVOR IV – 3yr FUTVF (36 mos) – Post Hoc Analysis Risk Ratio [95% CI] P-Value Interaction Risk Ratio Endeavor Taxus Diabetes Non-diabetes RVD 2.5mm >2.5 <3.0mm 3.0mm Lesion Length 10mm >10 <20mm 20mm Single Stent Multiple Stents OVERALL Pdiff=0.052 Favors Endeavor Favors Taxus 1 10 0.1 TVF (Target Vessel Failure) is defined as cardiac death, MI or TVR
ENDEAVOR IV – 3yr FUCD/MI (36 mos) – Post Hoc Analysis Risk Ratio [95% CI] P-Value Interaction Risk Ratio Endeavor Taxus Diabetes Non-diabetes RVD 2.5mm >2.5 <3.0mm 3.0mm Lesion Length 10mm >10 <20mm 20mm Single Stent Multiple Stents OVERALL Pdiff=0.005 Favors Endeavor Favors Taxus 1 10 0.1
ENDEAVOR IV – 3yr FUTVR (36 mos) – Post Hoc Analysis Risk Ratio [95% CI] P-Value Interaction Risk Ratio Endeavor Taxus Diabetes Non-diabetes RVD 2.5mm >2.5 <3.0mm 3.0mm Lesion Length 10mm >10 <20mm 20mm Single Stent Multiple Stents OVERALL Pdiff=0.608 Favors Endeavor Favors Taxus 1 10 0.1
Diabetics Endeavor IV
Endeavor (n=224) Taxus (n=218) ENDEAVOR IV – 3yr FU DiabeticsEfficacy Endpoints to 36 months P =0.113 P =0.347 P =0.790 P =0.744 Rate 22/224 19/218 32/224 34/218 35/224 47/218 29/224 36/218 MACE TLR TVF TVR Values are the event rates P values were calculated by Fisher Exact Test
Endeavor (n=224) Taxus (n=218) ENDEAVOR IV – 3yr FU DiabeticsSafety Endpoints to 36 months P =0.029 P =0.084 P =0.136 P =0.216 Rate P =0.493 3/224 9/218 13/224 9/218 1/218 3/224 7/218 6/224 16/218 Cardiac Death MI All Q-wave Non-Q Cardiac Death and MI Values are the event rates P values were calculated by Fisher Exact Test
Taxus Endeavor ENDEAVOR IV – 3yr FU DiabeticsCD/MI to 36 months 14% 12% 10% 8% Cumulative Incidence of Cardiac Death or MI 6% 4% 2% 0% 0 90 180 270 360 450 540 630 720 810 900 990 1080 Time after Initial Procedure (days)
Program Consistency Endeavor IV
Endeavor Randomized Clinical TrialsCD/MI at Latest Available Follow-up HR [95%CI] 4.19 [1.20-14.6] P=0.024 NNH=24 HR [95%CI] 1.93 [1.22-3.03] P=0.005 NNH=29 HR [95%CI] 1.28 [0.85-1.92] P=0.265 49/582 38/577 6/110 4/307 52/734 27/734 Endeavor II to 5 years Endeavor III to 4 years Endeavor IV to 3 years
Endeavor Randomized Clinical TrialsTLR at Latest Available Follow-up HR [95%CI] 0.81 [0.36-1.84] P=0.832 HR [95%CI] 0.92 [0.62-1.36] P=0.747 HR [95%CI] 2.19 [2.56-3.08] P<0.001 NNT=11 95/582 43/577 7/110 24/307 44/734 48/734 Endeavor II to 5 years Endeavor III to 4 years Endeavor IV to 3 years
Endeavor Clinical Program Pooled Safety and Efficacy Analyses Premarket Safety and Efficacy Package 1yr 2yr 3yr 4yr 5yr ENDEAVOR I Single Arm First-in-Man (n = 100) 5yr ENDEAVOR II 1:1 RCT vs. BMS (E = 598,D = 599) PK (n = 106) 5yr ENDEAVOR II CA Continued Access Single Arm (n = 296) 4yr ENDEAVOR III 3:1 RCT vs. Cypher® (E = 323,C = 113) 4yr ENDEAVOR IV 1:1 RCT vs. Taxus® (E = 773,T = 775) 3yr ENDEAVOR PK Pharmacokinetic Study (n = 43) 3yr ENDEAVOR Japan Single Arm (n = 99) 2yr Included in Pooled Safety and Efficacy Analyses (N=2132)
Endeavor Clinical Program Pooled DAPT Compliance to 5 yrs Endeavor: E I, E II, EII CA, E III, E IV (n = 2132) 96% DAPT1: E I, E II, E II CA, E III was ≥3 months 76% DAPT1: E IV was ≥6 months Adherence to DAPT (%) 39% 31% 24% 8% 8% Days 1. Protocol requirement DAPT usage based on case report forms. The optimal duration of dual antiplatelet therapy, specifically clopidogrel, is unknown and DES thrombosis may still occur despite continued therapy.
25% Endeavor Driver Before 1 year Endeavor: 5.4% Driver: 13.2% After 1 year Endeavor: 1.6% Driver: 3.3% 10% 20% 15% 5% Endeavor Pooled Efficacy Analysis Cumulative Incidence of TLR to 5 years 16.5% Cumulative Incidence of TLR 7.0% 0% 0 720 1080 1440 1800 360 Time After Initial Procedure (days) Values are the KM estimates.P-values were calculated by Log Rank Test.
15% Endeavor Driver Before 1 year Endeavor: 2.8% Driver: 4.5% After 1 year Endeavor: 2.7% Driver: 4.0% 10% 5% ENDEAVOR Pooled Safety Analysis Cumulative Incidence of CD/MI to 5 years 8.4% Cumulative Incidence of Cardiac Death or MI 5.4% 0% 0 720 1080 1440 1800 360 Time After Initial Procedure (days) Values are the KM estimates.P-values were calculated by Log Rank Test.
4% Endeavor Driver Before 1 year Endeavor: 0.6% Driver: 1.3% After 1 year (VLST) Endeavor: 0.2% Driver: 0.4% 1% 2% 3% Endeavor Pooled Safety Analysis ARC Definite/Probable ST to 5 years Cumulative Incidence of Def/Prob Thrombosis 1.7% 0.8% 0% 0 720 1080 1440 1800 360 Time After Initial Procedure (days) Values are the KM estimates.P-values were calculated by Log Rank Test.
Conclusions: Endeavor IV Late clinical FU (from 1-3 years) from theEndeavor IV RCT demonstrates: • Endeavor has a significant safety advantage cw Taxus; overall, 48% reduction in cardiac death + MI (P=0.004) due to a 91% reduction in VLST from 1-3 yrs (11 vs. 1 events; P=0.004). The VLST frequency of Endeavor (0.1%) is similar to a bare metal stent. • Endeavor @ 3 years, reduced TVF, the 1ry study endpoint, by 23%, from 15.9% to 12.3% (P=0.049) • Overall TLR @ 3 years was similar (Endeavor 6.5% vs. Taxus 6.0%) with a trend suggesting less late TLR (after 1 year) associated with Endeavor.
Conclusions: Endeavor Program In More than 2100 patients studied with over 1000 patients now out to 5 years in pooled analysis: • Low 7% TLR at 5 years in more than 1000 patients in ENDEAVOR Pooled Analysis • Despite only 39% of patients on DAPT at 1 year in ENDEAVOR Pooled Analysis:1 • Low 0.8% ST2 to 5 years (BMS = 1.7%, p = 0.061) • Extremely low 0.2% VLST2 after 1 year through 5 years • Significant reduction in CD/MI vs. BMS at 5 years (Endeavor 5.5% vs. BMS 8.4%, p = 0.009)