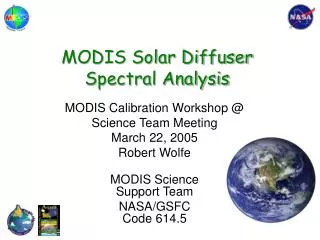
MODIS Solar Diffuser Spectral Analysis
MODIS Solar Diffuser Spectral Analysis. MODIS Calibration Workshop @ Science Team Meeting March 22, 2005 Robert Wolfe MODIS Science Support Team NASA/GSFC Code 614.5. Outline. Overview and modeling 1 week of Earthshine (with browse) 1 year of Earthshine Summary.

MODIS Solar Diffuser Spectral Analysis
E N D
Presentation Transcript
MODIS Solar Diffuser Spectral Analysis MODIS Calibration Workshop @ Science Team Meeting March 22, 2005 Robert Wolfe MODIS Science Support Team NASA/GSFC Code 614.5
Outline • Overview and modeling • 1 week of Earthshine (with browse) • 1 year of Earthshine • Summary
Simplified Solar Diffuser Geometry Direct Light - full illumination Earth Shine (reflected light) - partial illumination - atmospheric attenuation - clouds and shadows - sun glint - varying albedo - complicated BRDF
Frame 10805 Time: 10:17:01Z Nadir Sun El: -05 Pacific Ocean 07/21/2003 ISS007E 377 km Alt.
MODIS Simulated Earthshine Effect Solar Diffuser mean at Sweet-spot (SS) center (12.5 degrees elevation)
Earthshine BRDF and Atmosphere Modeling • Atmosphere: represented by one of the AERONET retrievals for clear conditions (bi-modal size distribution, continental) • uses aerosol phase function in 5 wavelengths • aerosol optical thickness: 0.11 • single scattering albedo: 0.88 • Ocean surface BRDF model: Nakajima & Tanaka model (related to Cox & Munk) with the wave mutual shadowing. • Land surface BRDF Model: Modified Li-Strahler model which is called Li-transit model (by Gao, Li, Strahler et al.). • Corrects the BRDF behavior at high zenith angles. • 3 model parameters derived by the least squares fit to the PARABOLA measurements over conifer and spruce forests. • Reasonable agreement with VIIRS (Steve Mills) calculations. Some disagreements may be due to: • difference in view geometry, aperture location/size and no screen (our calculations are for MODIS) • difference in the ocean reflectance model. We use the azimuthally independent model; NGST most likely used the model of Cox Munk with Grams-Charlier expansion which depends on the wind direction. BRDF and Atmosphere modeling by: Alexei Lyapustin
MODIS/Terra m1s (7 days, Ocean bands) (linear fit removed) Day 1280 -- 2003/184 (July 3)
MODIS/Terra m1s (7 days, Land/Atmos. bands) (linear fit removed) Day 1280 -- 2003/184 (July 3)
1. -0.15 (band 16 m1 residual) Browse by Donna Thomas (MODIS Ocean Team)
MODIS/Terra m1s (1 year, Ocean bands) (linear fit removed, 339 days)
MODIS/Terra m1s (1 year, Land/Atmos. bands) (linear fit removed, 339 days)
Band 8 vs. 9 and 16 (after 11 day smooth fit removed)
Band 15 vs. 9 and 16 (after 11 day smooth fit removed)
VIS NIR S/MWIR All bands vs. Band 9 (after 11 day smooth fit removed)
VIS NIR S/MWIR All bands vs. Band 16 (after 11 day smooth fit removed)
Summary • Early Terra SD measurements (before July 2003) and Aqua SD measurements are done once per week and not averaged (smoothed) so individual measurements may be contaminated • The Earthshine bias (~0.5%) should be estimated • Non-uniform illumination of SD may contribute to detector striping • A better understanding is needed of atmosphere and cloud contribution to the short (VIS) wave lengths • Possible SD/Earthshine model improvements: atmosphere, sea-surface, polarization, etc.