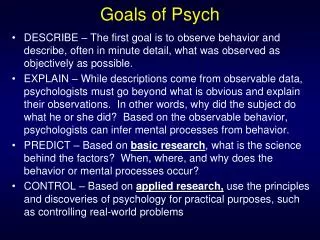
Understanding the Chi-Square Test for Association with Categorical Variables
200 likes | 339 Vues
This document explores the Chi-Square Test for Association used to determine relationships between two categorical variables, exemplified by the types and conditions of trees sampled from a forest. It explains null and alternative hypotheses, the calculation of observed and expected frequencies, and how to assess independence between variables. The method is clarified through a case study involving deciduous and evergreen trees. Key statistical concepts, including degrees of freedom and critical values for rejecting hypotheses, provide a foundation for further statistical analysis and interpretation.

Understanding the Chi-Square Test for Association with Categorical Variables
E N D
Presentation Transcript
Psych 5500/6500 Chi-Square (Part Two) Test for Association Fall, 2008
Test for Association Used to determine whether two variables are associated (related). The variables are both categorical; which can be nominal, ordinal, or even cardinal scores divided into intervals. H0: the variables are independent Ha: the variables are associated
Example We will begin with an example where the variables are ‘type of tree’ (deciduous or evergreen) and ‘condition of tree’ (normal, diseased, or has parasites). We sample 310 trees from a forest and note both what type of tree it is as well as its condition. Each tree must fall into one and only one of the six cells of the table (we will assume that a tree can’t both be diseased and have parasites at the same time).
Observed Frequencies As our variables are categorical in nature, the only thing we can really do with the data is to count how many trees fall into each category (e.g. it makes no sense to find the mean condition of the trees). The data are given below, these are our observed frequencies.
Expected Frequencies We have our observed frequencies, next we need to determine what the frequencies would look like if H0 were true and the variables were independent (i.e. not associated). Then, we can use Chi Square to see if our obtained frequencies differ significantly from the frequencies we would expect to get if H0 were true.
Independence If H0 is true and our variables are independent then that means that knowing in which category a tree falls in one variable is of no help in predicting in which category it falls in the other variable. In other words, if the variables are independent then knowing what type of tree it is (deciduous or evergreen) does not help us predict what condition the tree is in (normal, diseased, parasitic). And, knowing what condition the tree is in does not help us predict which type of tree it is. Let’s see what the frequencies would look like if the variables were independent.
First, in this table I have calculated the total number of trees that were normal (100), diseased (120), and parasitic (90), which add up to 310 (the total number of trees). I have also calculated the total number of trees that were deciduous (186) and evergreen (124) which also add up to 310.
Second, if we ignore the variable ‘type of tree’ we can see that overall 100 of the 310 trees were ‘normal’, so we can say that the proportion of trees that were normal is .32, or 32%. We can also see that .39 (39%) of the trees were diseased, and .29 (29%) had parasites.
Independence Third, this table shows what the proportions would look like if the two variables were independent, we can see that knowing which type of tree it is does not change the chances of it being normal, diseased, or parasitic.
Expected Frequencies Fourth, the expected frequencies are those we would expect to get in each cell if H0 were true and the variables were independent. So the next step is to use the expected proportions (repeated below) to compute the expected frequencies if Ho were true (next slide)
If the variables are independent then 32% of the 186 deciduous trees would be normal, and 32% of the 124 evergreen trees would be normal, and so on. These are what the frequencies would be if the variables were independent. Note the number of deciduous trees still adds up to 186 and the number of evergreen to 124.
Observed Frequencies (our actual data) Expected Frequencies (if H0 true) The obtained frequencies differ somewhat from the frequencies we would expect if H0 were true, do they differ enough to reject H0?
Chi Square Test for Association This is the same formula as for ‘goodness of fit’. This time we apply it to the observed and expected frequencies from each cell. The formula for degrees of freedom for the test for association: df = (# of rows – 1)(# of cols – 1) Which in this example would be: df = (3-1)(2-1) =2
Chi Square Test for Association If H0 is true the mean value of χ²=df=2. If H0 is false then the value of χ² is expected to be greater than 2. How large does χ² have to be do reject H0? With two degrees of freedom χ²critical=5.991. As χ²obtained=26.185 we easily reject H0 and conclude that there is a relationship (association) between the two variables ‘type of tree’ and ‘condition of tree’. In the standard format the results would be χ²(2)=26.185, p<.001
‘Eyeballing’ an Association While Chi Square works with frequencies, it is not all that easy to look at a table of frequencies and guess whether the variables are associated or not. Table of Frequencies
‘Eyeballing’ an Association It is much easier to view the proportions or percents. If the sample exactly fits the null hypothesis then the columns would be identical. Here are the percentages from our example, the columns are not all the same, thus the variables may be associated (get a p value to make sure). Table of Percents
Effect Size: Cramer’s V The value of χ² obtained and it’s corresponding p value are affected by both the strength of the association between the two variable and the size of N and thus are not direct indications of how strongly the two variables are associated. A measure that removes the effect of N, leaving just a measure of the strength of the relationship between the two variables is Cramer’s V.
Cramer’s V The formula for computing Cramer’s V is quite simple: This will result in a value of V that is between 0 (no association between the variables) and 1 (the strongest possible association between the variables). V is a pure measure of strength of association (having removed the effect of N). By the way, why not use a formula that will result in a value between –1 and 1, as in correlation? Think about it.
Strength of Association Examples V=0 V=1.00