Download
1 / 32
320 likes | 365 Vues
Learn about ANOVA, comparing concentration values of nitrogen in plant species, seeds production under different light regimes, and more. Understand why ANOVA is preferred over multiple t-tests and how to interpret results.

E N D
Analysisof variance ANOVA
Examples of problems • We compare concentration values of nitrogen in leaves of five related plant species • We compare number of seeds produced by plants grown (each grown independently!) under five different light regimes • Generally – we compare more than 2 groups
Why don’t test in pairs and don’t use series of t-tests? Species A Species B Species C
If we have k groups (and we compare k means) • We use k.(k-1)/2 tests. Probability of Type I error is α in each of them. • The chance, that we make at least one Type I error, increases then with number of means compared.
Probability, that we make Type I error using more t tests during searching among all the pairs in group of kmeans. „Statistical fishing“
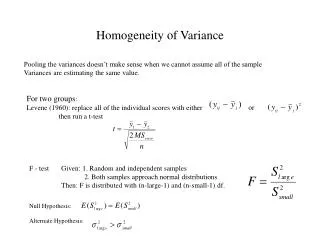
Thus I test just one hypothesis • “All groups are the same” • or better • H0: 1=2=3= ...= k. • Providing homogeneity of variance (and normality). • HAsays then: it isn’t true, that all the means are the same (at least one of them differ from the rest ones)
Analysis of variance • = ANOVA (ANalysis Of VAriance) • In the most simple case - Single Factor ANOVA, one-way ANOVA
Model: Xij = μ+αi + εij “error” (random) variability N(0, σ2) Independent of α “shift” of group i against general mean general mean Null hypothesis can be then written αij = 0 (in other words – there is no shift among groups, just error variability)
Data – 3 groups group means The question is – what probability will be, that such or more variable means I get, if the samples are from one population? What variability we can expect, can be computed as Overall/grand mean
Data – 3 groups Variability is sum of squares of deviations (from the respective mean) group means Within groups Overall/grand mean Estimation of general variance (in the case, that H0 is true) based on variability inside groups
Data – 3 groups Variability is sum of squares of deviations (from the mean) group means Among groups Overall/grand mean Multiply by group size Estimation of general variance (in the case, that H0 is true) based on variability among groups
Data – 3 groups Variability is sum of squares of deviations (from the mean) group means general variability Overall/grand mean Even here holds, that MSTOT = SSTOT/DFTOT (it isn’t much useful though)
holds Thus ANALYSIS OF VARIANCE - I decompose variance into its components
I have two estimates of variance (MSG and MSe) and if null hypothesis is true • If null hypothesis is true, then they are estimates of the same value. Ratio of two estimates of variance (of variables with normal distribution) has F-distribution. If the groups come from populations differing in means, then the variability among groups is bigger than variability inside groups.
Variability among groups can be proved just against variability inside groups!!!
Test’s process is classic Attention, we have two degrees of freedom (numerator and denominator) again Probability, that variability among means is this big or bigger (if H0 is true)
Nowadays prints P=0.026
Statistica prints Intercept is a test of null hypothesis, that grand mean is 0. In most cases such null hypothesis is clearly absurd and then it has no sense to mention this in publications.
I have two groups (k=2), should I use ANOVA, or t-test? It doesn’t matter, as P is exactly the same in both cases (F is a square of given t)
Power of test • Increases with deviation from H0 - we cannot affect in though :( • Increases with number of observations in group • Increases with balance of groups • Decreases with number of groups (don’t try to compare many groups with small numbers of replications within groups!)
Violation of assumptions Robustness • Robustness to violation of normality increases with number of observations in group • Robustness to disturbance of homogeneity of variances decreases rapidly in unbalanced group sizes
Factors with fixed and random effects • I want to find out limitation of the element in food: Rabbits feed with normal food and food enriched with magnesium, calcium and ferrum a. - Fixed effect – I am interested in, which one is the best, if any. etc. • I have 10 randomly chosen plants from a meadow and I am interested whether their offsprings differ according to the parent plant - random effect – it doesn’t matter, if better offspring originates from my plant no.1 or my plant no.3.
Fortunately • One way ANOVA is the same for fixed and random factor.
For factors with fixed effect • It isn’t enough to know, that groups aren’t the same, I want to know, what differs from what. • This question hasn’t one good solution (thus it has a lot of them). • Experiment-wise vs. comparison-wise Type I error rate. • Bonferroni
Multiple comparison tests Tukey - “classic” (that probability of Type I error was lower than α at least in one test- i.e. before given level of significance, usually 5%). Analogue of multiple t-tests Critical values depend on k. For big k is the test very weak (a lot of partial tests is done). SE is estimated on the basis of all groups, not only those ones compared (to make denominator DF bigger and thus power of test too - attention – there is considerable sensitivity to violation of homogeneity of variances.
In graphic form There is something strange – we probably committed to Type II error [but we usually pretend that this is alright]. As you can see, Tukey is not ideal (nothing is ideal in multiple comparisons), but, at least, no-one will criticise you too much
What are the other possibilities? • Dunnet –test each “treatment” group against single control: fewer tests (increases just linearly with number of groups) => more powerful test. I can use one-tailed tests too. • Contrasts – testing of “groups of groups”, usually logically planed • Planed observations
Non-parametric possibilities in lieu of ANOVA • Permutation tests (randomly divided observations to groups of the same size as in experiment, this generates my own distributions of test statistic under the null hypothesis) • Kruskal-Wallis test – based on rank • Both tests test H0, that samples are from one population. If formulated as location tests, assumption is that distribution shape is the same in all the groups. • Median test – I compare number of observations above and below common median in each groups.
Kruskal-Wallis Ri – sum of ranks in single groups ni – sum of observations in single groups N – collective number of observations