Download
1 / 44
440 likes | 584 Vues
District 10 Demographic Profile. Prepared for CCBA Implementation Committee 2/21/12. District 10. District 10 is comprised of: Potrero Hill, Central Waterfront, Dogpatch, Bayview/Hunters Point, India Basin, Silver Terrace, Visitacion Valley, and Candlestick

E N D
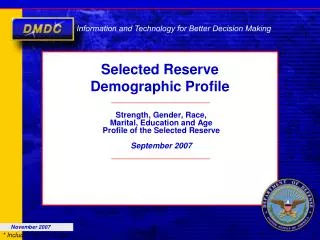
District 10 Demographic Profile Prepared for CCBA Implementation Committee 2/21/12
District 10 District 10 is comprised of: Potrero Hill, Central Waterfront, Dogpatch, Bayview/Hunters Point, India Basin, Silver Terrace, Visitacion Valley, and Candlestick This analysis gives special attention to the largest of these neighborhoods: Bayview/Hunters Point, Potrero Hill, and Visitacion Valley, Although not perfectly aligned, District 10 roughly approximates the boundaries of the 94124, 94134, and 94107 zipcodes
Population Growth According to the 2010 census, San Francisco’s population grew almost 4% since 2000 to 805,325 residents With a total population of 78,660, District 10 (D10) is the 3rd most populated of SF’s supervisorial districts Between the 2000 and 2010 census, D10 grew about 10%, adding 7,410 new residents
Population of D10 Neighborhoods D10 consists of almost 80,000 residents living in more than 22,000 households, of which almost 35% include children. The average household size in District 10 is 3.3 persons.
Changes in Composition 2000-2010 Citywide: Asians experienced the greatest increase, 11.8% equating to an additional 28,350 individuals More residents also claimed “Two or More Races,” or “Other Race,” – increase of 13.2% (4,400) and 5.3% (2,650), respectively The number of African American residents declined significantly – by 19.2% (11,650) citywide In District 10: Asian residents increased from 32% to 37% of the population African Americans decreased to 21% Latinos (any race) increased from 17% to 21%
Change in Ethnic/Racial Composition of D10 *Latinos may be of any race.
Age of District 10 Residents • D10 population is younger than that of the city overall. • The majority of D10 residents are already of “working age”. • The percent in the labor force will grow over the next decade.
Educational Attainment of Residents (25+) • Educational attainment in D10 increased since 2000, with 5% more residents over the age of 25 having a bachelor’s degree or higher. • Potrero is an outlier with significantly greater educational attainment than BV/HP or Vis Valley.
A Notable % of Students in D10 High Schools Don’t Complete Thurgood Marshall (94124) – An average of 26% of starting students do not complete high school Burton Academic High (94134) – An average of 46% of starting students do not complete high school
Income District 10 has among the lowest median and per capita incomes in the City.
D10 Neighborhoods Have High Poverty In Common but Per Capita Income Varies Greatly Poverty Rates Per Capita Income
Even Those That Are Employed Struggle to Make Ends Meet Given High Cost of Living
% of CalWorks Cases - July 2011 District 10 residents make up a disproportionate share of the CalWorks caseload.
CalFresh (a.k.a. Food Stamps) Between September 2009 and September 2011, the number of San Francisco residents receiving food stamps increased 42% to 27,881 In September 2011, more than 20% of food stamp funds distributed in SF went to residents of the Bayview/HP, Potrero, and Visitacion Valley (up approx 1% since 2009) However, only 8% (3,190) of the 11,319 SF children receiving food stamps live in these neighborhoods
D10 Residents Almost One Quarter (24%) of CAAP Caseload And D10 residents are an even higher percentage (27%) of those considered able to work (i.e., PAES and GA recipients)
Public Housing More than 3,500 District 10 residents live in public housing. D10 is home to some of the City’s largest public housing complexes and includes more than one third (37%) of the City’s public housing units and the majority of its multi-bedroom units.
Home Ownership & Foreclosures Home ownership rate in District 10 is among the highest in the City at 52% (compared to 38% overall). Despite SF foreclosure rates being quite low overall, foreclosure rates in Bayview exceed state and nat’l levels (see chart below)
Financially Underserved In San Francisco, it is estimated that 5.7% of households are unbanked 13.6% of households are underbanked
Many District 10 Families At-Risk of Being Un- or Underbanked
Credit Histories Significant minorities of District 10 residents lack credit histories
Unemployment District 10 unemployment rates consistently exceed those of the City overall 2005-2009 ACS data indicate unemployment rates of 7% and 12% for San Francisco and District 10 respectively Within D10, Bayview/HP has the highest rate of unemployment
Correlation between Demographics and Unemployment Rates The unemployment rates of D10 and its neighborhoods are consistent with higher unemployment rates for minority populations In Dec 2011, the unemployment rate for California was 11.6% For African-Americans, it was 19.6% and for hispanics, 13.8% Youth unemployment rates are even higher: 2007 – 16.1%; 2009 - 33.1%
Unemployment Lasting Longer Between 2008 and 2010, San Francisco lost 30,000 jobs Since then, SF has only gained 500 jobs per year Growth in IT offset by losses in construction and the public sector In March 2010, 41% of unemployed had been out of work for 12 – 24 months
Jobs Held by District 10 Residents Bayview and VisValley workers are less likely to hold relatively high-paying management jobs than residents of Potrero or the City overall
Transportation 19% of District 10 residents report not having a car in 2010 (up from 10% in 2000) Of those working, 60% report commuting by car and 27% by transit (changes from 68% and 24% respectively since 2000)
Sector Academies Jan ‘10 – June ‘11 City Build Health Care Train Green
Sources 2000 Census Data by Supervisorial District, San Francisco Office of the Legislative Analyst, November 4, 2002. CalFresh, Quarterly Report, San Francisco Human Services Agency, September 2011. California Demographic Labor Force, Summary Tables, U.S. Bureau of Labor Statistics, December 2011. County Adult Assistance Program (CAAP) Six Month Update, San Francisco Human Services Agency Planning Unit, Data through December 2011. Demographic and Poverty Trends in San Francisco , San Francisco Human Services Agency, June 16, 2011. “Homes for the 99 Percent,” SF Bay Guardian, Dec 6, 2011 Local Asset Poverty Index, Asset Policy Initiative of California, EARN, 2006. JoinBankOn.org One-Stop Jobseeker Demographics July-Dec 2011, Office of Economic and Workforce Development. Presentation of San Francisco City Economist, Ted Egan, to Workforce Investment San Francisco (WISF), Sept 2011.
Sources (cont.) Promoting Power Database, Alliance for Education, www.all4ed.org. Report to the CalWORKs Oversight Committee Meeting, San Francisco Human Services Agency, Data through August 2011. San Francisco Housing Authority, Public Housing Units, 2008. San Francisco Neighborhood Market DrillDown, Social Compact, March 2008. San Francisco Neighborhoods Socio-Economic Profiles, 2005-2009 American Community Survey, San Francisco Planning Dept, May 2011. San Francisco Socio-Economic Profile, 2005-2009 American Community Survey, May 2011 (Supervisorial Districts) Sector Academy Demographic Report, Office of Economic and Workforce Development, Jan 2010 – June 2011. The Self-Sufficiency Standard for San Francisco County, 2008, Insight Center for Community Economic Development.