Download
1 / 44
440 likes | 625 Vues
University of Toronto Electrical and Computer Engineering Department. A Profiler for a Multi-Core Multi-FPGA System. by Daniel Nunes Supervisor: Professor Paul Chow. September 30 th , 2008. Overview. Background Profiling Model The Profiler Case Studies Conclusions Future Work. User

E N D
University of TorontoElectrical and Computer Engineering Department A Profiler for a Multi-Core Multi-FPGA System by Daniel Nunes Supervisor: Professor Paul Chow September 30th, 2008
Overview • Background • Profiling Model • The Profiler • Case Studies • Conclusions • Future Work
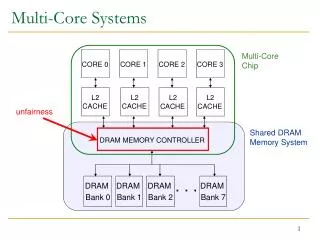
User FPGA User FPGA Ctrl FPGA User FPGA User FPGA How Do We Program This System? • Lets look at what traditional clusters use and try to port it to these type of machines
Traditional Clusters • MPI is a de facto standard for parallel HPC • MPI can also be used to program a cluster of FPGAs
The TMD • Heterogeneous multi-core multi-FPGA system developed at UofT • Uses message passing (TMD-MPI)
TMD-MPI • Subset of the MPI standard • Allows an independence between the application and the hardware • TMD-MPI functionality is also implemented in hardware (TMD-MPE)
TMD-MPI – Rendezvous Protocol • This implementation uses the Rendezvous protocol, a synchronous communication mode Req. to Send Acknowledge Data
MB PPC MB PPC MB MB PPC PPC PPC The TMD Implementation on BEE2 Boards NoC NoC User FPGA User FPGA Ctrl FPGA NoC User FPGA User FPGA NoC NoC
How Do We Profile This System? • Lets look at how it is done in traditional clusters and try to adapt it to hardware
MPICH - MPE • Collects information from MPI calls and defined user states through embedded calls • Includes a tool to view all log files (Jumpshot)
Goals Of This Work • Implement a hardware profiler capable of extracting the same data as the MPE • Make it less intrusive • Make it compatible with the API used by MPE • Make it compatible with Jumpshot
PPC PPC Send Tracer TMD MPE Send Tracer TMD MPE Tracers Processor’s Computation Tracer • The Profiler interacts with the computation elements through tracers that register important events • TMD-MPE requires two tracers due to its parallel nature Processor’s Computation Tracer Receive Tracer Engine’s Computation Tracer Receive Tracer
32 32 32 Tracers - Hardware Engine Computation Cycle Counter R0 MUX Tracer for Hardware Engine
32 32 32 32 32 TMD MPE Tracers - TMD-MPE Cycle Counter MUX R2 R0 R1 R3 MUX R4 32 MPE Data Reg MUX Tracer for TMD-MPE
PPC 32 32 32 32 Tracers – Processors Computation Cycle Counter Stack Register Bank (5 x 32 bits) Register Bank (9 x 32 bits) Stack MPI Calls States User Define States MUX Tracer for PowerPC/MicroBlaze
Tracer Gather Profiler’s Network User FPGA Control FPGA Tracer Tracer . . . Collector DDR
Synchronization • Synchronization within the same board • Release reset of the cycle counters simultaneously • Synchronization between boards • Periodically exchange of messages between the root board and all other boards
Profiler’s Flow Collect Data After Execution Dump to Host Back End Convert To CLOG2 Convert To SLOG2 Front End Visualize with Jumpshot
Case Studies • Barrier • Sequential vs Binary Tree • TMD-MPE - Unexpected Message Queue • Unexpected Message Queue addressable by rank • The Heat Equation • Blocking Calls vs Non-Blocking Calls • LINPACK Benchmark • 16 Node System Calculating a LU Decomposition of a Matrix
0 0 1 2 3 4 5 6 7 1 2 3 4 5 6 7 Barrier • Synchronization call – No node will advance until all nodes have reached the barrier
Barrier Implemented Sequentially Receive Send
Barrier Implemented as a Binary Tree Receive Send
TMD-MPE – Unexpected Messages Queue • All request to send that arrive to a node before it issues a MPI_RECV are kept in this queue.
TMD-MPE – Unexpected Messages Queue Queue Search and Reorganization Receive Send
TMD-MPE – Unexpected Messages Queue Queue Search and Reorganization Receive Send
TMD-MPE – Unexpected Messages Queue Receive Send
The Heat Equation Application • Partial differential equation that describes the temperature change over time
The Heat Equation Application Computation Receive Send
The Heat Equation Application Computation Receive Send
The LINPACK Benchmark • Solves a system of linear equations • LU factorization with partial pivoting
0 1 2 3 4 5 n-3 n-2 n-1 assigned to Rank 0 assigned to Rank 1 assigned to Rank 2 The LINPACK Benchmark
The LINPACK Benchmark Computation Receive Send
The LINPACK Benchmark Computation Receive Send
Conclusions • All major features of the MPE were implemented • The profiler was successfully used to study the behavior of the applications • Less intrusive • More events available to profile • Can profile network components • Compatible with existing profiling software environments
Future Work • Reduce the footprint of the profiler’s hardware blocks. • Profile the Microblaze and PowerPC in a non-intrusive way. • Allow real-time profiling
The TMD (2) Computation Node Off-Chip Communications Node PPC InterChip Network On-chip TMD-MPE Off-Chip Communications Node FSL XAUI TMD-MPE Computation Node Network Interface Hardware Engine FSL
Profiler (2) DCR DCR2FSL Bridge PPC PLB From Cycle Counter TMD-MPE GPIO From Cycle Counter Tracer RX Tracer TX Tracer Comp To Gather Processor Profiler Architecture TMD-MPE From Cycle Counter From Cycle Counter Tracer RX Tracer TX Tracer Comp To Gather Engine Profiler Architecture
Profiler (1) Switch Board N Board 0 XAUI Cycle Counter PPC Gather Network On-chip Collector DDR μB IC IC Control FPGA User FPGA 4 User FPGA 1 IC IC PPC Network On-chip μB Gather Cycle Counter
Profiler (2) DCR DCR2FSL Bridge PPC PLB From Cycle Counter TMD-MPE GPIO From Cycle Counter Tracer RX Tracer TX Tracer Comp To Gather Processor Profiler Architecture TMD-MPE From Cycle Counter From Cycle Counter Tracer RX Tracer TX Tracer Comp To Gather Engine Profiler Architecture
Hardware Profiling Benefits • Less intrusive • More events available to profile • Can profile network components • Compatible with existing profiling software environments