Download
1 / 16
160 likes | 402 Vues
BIOL 582. Lecture Set 3 Probability Distributions. BIOL 582. Review. We learned that we could empirically generate distributions for things like test statistics Recall from R examples,. BIOL 582. Review.

E N D
BIOL 582 Lecture Set 3 Probability Distributions
BIOL 582 Review • We learned that we could empirically generate distributions for things like test statistics • Recall from R examples,
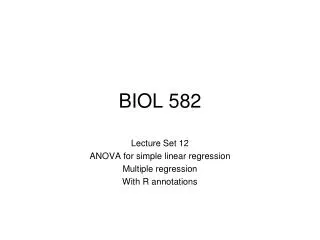
BIOL 582 Review • We learned that we could empirically generate distributions for things like test statistics • Recall from R examples, but a slight change By changing frequency to density, the height of the distribution at any point measures the probability of the value found on the x axis
BIOL 582 Review • We learned that we could empirically generate distributions for things like test statistics • Recall from R examples, but a slight change Red line is the probability density function for the standard normal distribution. It is “theoretical”. If the data fit this line well, it can be used as a proxy for estimating the probability of any event described on the x axis
BIOL 582 Probability distributions • May be empirical (generated; becoming more common) or theoretical (based on probability theory; historically pervasive). • There are several different theoretical probability distributions, each having utility under certain conditions • Theoretical probability distributions are often called parametric distributions, as the attributes of such distributions are influenced by the “behavior” of various parameters. (E.g., the shape of the normal distribution is influenced by the behavior of the mean and variance) • Inferential statistical methods that rely on parametric probability distributions are called parametric tests.
BIOL 582 Probability distributions
BIOL 582 Probability distributions
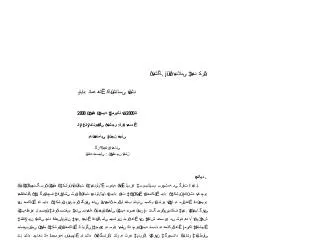
BIOL 582 Common Distributions Binomial distribution for n = 20 p = 0.1 (blue), p = 0.5 (green) and p = 0.8 (red) x-axis is k (number of events = “success”) Taken from Wikipedia
BIOL 582 Common Distributions
BIOL 582 Common Distributions
BIOL 582 Common Distributions
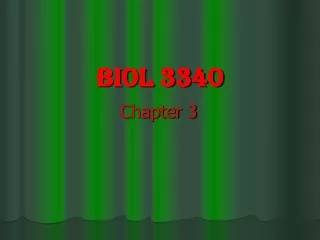
BIOL 582 Common Distributions Notice that as n increases (meaning the df increases), the t-distribution converges on the normal distribution. One way to think of the t-distribution is that it is a standard normal distribution, corrected for small sample sizes.
BIOL 582 Common Distributions
BIOL 582 Common Distributions
BIOL 582 Common Distributions
BIOL 582 Final thoughts • There are MANY more distributions. This is just a sample. • These distributions are “simulations” for the distributions of variables, parameters, or text statistics. There are other ways to simulate distributions. • These are all parametric distributions. • Often, one asks if the data “Fit” a distribution. • Using a PMF or PDF, one can estimate the expected values of a theoretical distribution. • One can then compare that to observed densities (frequencies). • Which has degrees of freedom equal to the “bins” for comparison • Thus, a theoretical distribution can be used to see if data fit some other distribution • This lecture should be referenced anytime we use a parametric test with a specific distributional form for estimating the probability of a type I error.