Download
1 / 20
200 likes | 371 Vues
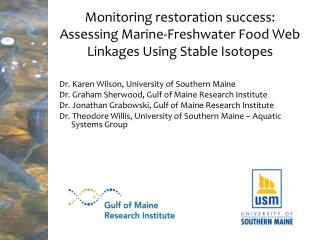
Monitoring restoration success: Assessing Marine-Freshwater Food Web Linkages Using Stable Isotopes. Dr. Karen Wilson, University of Southern Maine Dr. Graham Sherwood, Gulf of Maine Research Institute Dr. Jonathan Grabowski, Gulf of Maine Research Institute

E N D
Monitoring restoration success: Assessing Marine-Freshwater Food Web Linkages Using Stable Isotopes Dr. Karen Wilson, University of Southern Maine Dr. Graham Sherwood, Gulf of Maine Research Institute Dr. Jonathan Grabowski, Gulf of Maine Research Institute Dr. Theodore Willis, University of Southern Maine – Aquatic Systems Group
Elvers move upstream Spawning ALE Mature adult eels leave freshwater ALE YOY ALE YOY exit lakes ALE YOY exit lakes Adult alewife Spawning bluebacks Spawning shad shad YOY Spawning salmon sea lamprey larvae Spawning sea lamprey Juvenile lamprey migrate to sea Salmon parr Blueback YOY Shad Shad YOY exit river Spawning Smelt smelt YOY Smelt YOY exit river Salmon smolt exit river Adult salmon Adult bluebacks Blueback YOY exit river Smelt ad April May June July Aug Sept Oct Nov ponds/lakes Mainstem or tributary Also in the lower river: Shortnose sturgeon Atlantic sturgeon Tomcod Striped Bass tidal fresh tidal brackish estuary
Food Web Restoration Indicators See http://www.umaine.edu/searunfish/penobscotexchange/PRFramework_final.pdf
Carbon and Nitrogen stable isotopes: “you are what you eat” • Light (common) & heavy (rare) isotope forms differ by # of neutrons • Heavy nitrogen (15N) is more difficult to excrete, so is accumulated from prey to predator as it moves up the food chain • Approximately 3 – 4 δ15N(‰) units between trophic levels (primary producer, primary consumer, secondary consumer, etc) • Primary producers [plants] assimilate heavy carbon (13C) under carbon-limited conditions, which vary depending upon habitat • Animals do not distinguish between heavy & light carbon, so carbon reflects the original source of carbon in their prey
You are what you eat: • 15N indicates trophic position • 13C indicates habitat- in this case: • freshwater (lighter) • marine (heavier) • Other critical advantage: stable isotope signatures of slow turn-over tissues integrate feeding relationships over many months
With increases in anadromous fish, particularly alewife, it is expected that: • Spawning alewife add marine-derived nutrients through spawning, excretion & mortality, shifting freshwater 15N signatures higher and enriching freshwater 13C towards heavier (marine) values. • YOY or juvenile alewife may become important forage for larger predators, increasing trophic position of some species (SMB, CP, cod, mackerel). • Nearshore marine predators may consume out-migrating YOY alewife in greater numbers, shifting marine 13C signatures towards lighter (freshwater) values.
Before Restoration After Restoration Expectations: carbon Marine carbon signature -16 d13C(‰) Freshwater carbon signature - 26 freshwater marine river mouth Distance from river mouth
Field collections • Muscle tissue samples from common fish & top predators (bass, chain pickerel, cod, mackerel) • freshwater fish collected in collaboration with U. Maine Fish Index Surveys • marine fish collected in part in collaboration with MeDMR • Tissue samples from food web base • primary consumers including snails (benthic algae) & mussels (phytoplankton) • secondary consumers (crayfish, crabs, insects)
Marine sites: Penobscot Bay A B C D E
RV ‘Gadid’ - GMRI September 2009
FW mackerel blueback alewife Marine lamprey 14 lobster CP cod, sculpin, crab, pollock 12 SMB WS CP SMB SMB PS 10 GS RBSF RBSF sea star eel WS YP WS predatory snail del 15N YP PS eel WS eel brittle star 8 Odonata mussel Odonata bivalve urchin 6 snail Odonata snail snail Penobscot Bay Pushaw Stream snail 4 Pen Riv Below VZD mussels snail bivave Pen GW Impoundment Pen VZ Impoundment 2 -35 -30 -25 -20 -15 -10 -5 del 13C
Influenced by adult alewife? { 1 0.8 0.6 Percent FW influence Influenced by juvenile alewife? 0.4 0.2 Cod 0 Chain pickerel SMB Mackerel Alewife Blueback -0.2
Connectivity -10 -15 -20 Del 13C -25 Inverts_River Fish_River Inverts_Bay -30 Fish_Bay -35 A B C D E GWI VZDI Pushaw Below VZD River Mouth
What’s next? • Analyze new samples (more fish and inverts from Pen bay and additional tributaries) • Comparison to Kennebec River system (2010) • Re-sampling post dam removal
Mechanisms: high abundances of river herring Spring Freshwater Summer Marine Fall