Download
1 / 30
330 likes | 513 Vues
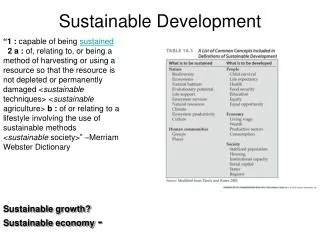
Sustainable Development. Ch. 20. China: an example of economic growth. It is the third largest in the world after the EU and US with a nominal GDP of US$ 8.22 trillion (2012) when measured in exchange-rate terms.

E N D
Sustainable Development • Ch. 20
China: an example of economic growth • It is the third largest in the world after the EU and US with a nominal GDP of US$8.22 trillion (2012) when measured in exchange-rate terms.
China has been the fastest-growing major nation for the past quarter of a century with an average annual GDP growth rate about 9.3 (2008-2011). • China's per capita income has grown at an average annual rate of more than 8% over the last three decades drastically reducing poverty.
This is a great economic growth model • But what are the costs? • This rapid growth has been accompanied by rising income inequalities. • The country's per capita income is classified in the lower middle category by world standards, at about $3,180 (nominal, 104th of 178 countries/economies), and $5,943 (PPP, 97th of 178 countries/economies) in 2008, according to the IMF. • What is more important? a Long-run view!
China's dazzling economic growth, but when the negative effects of China's pollution are factored in, the growth rate is less impressive. • The Chinese government has calculated that the effects of pollution wiped out $67 billion, or 3 percent of the nation's GDP, in 2004. • The World Bank calculates that pollution costs China about 5.8 percent of GDP every year.
A man collects dead fish in Donghu lake, where officials say an estimated 30,000kg of fish have been killed by a combination of pollution and hot weather
In China, packaging and containers has been associated with a problem called "White Pollution”. The lack of environmental awareness amongst the citizenry contribute to the adverse impact caused by plastic materials; they throw away used foam boxes everywhere, unaware of the effect on their city’s image and environment.
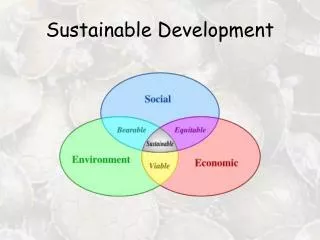
In some situations there is a trade-off between economic growth and environmental quality, with expansion of some economic activities coming at the cost of depleted resources or increased pollution • In other situations, the 2 are complements: with prudent resource management a critical component of sustained growth
What is the relationship between economic development, natural resource management, and environmental quality? • Is there a trade-off in which economic growth can proceed only at the cost of continued environmental degradation? • Are environmental quality and growth sometimes complementary?
A country’s environment is a valuable natural resource. • These resources can be critical inputs to economic activity, job creation, and growth. • Prudent management of fisheries can help provide sustainable source of food for fisheries and their families or support large scale commercial fishing
To some extent, all economic activity uses the environment as a dump for waste products. • Environment damage can have substantial detrimental effects on health and welfare. • Contaminated water (water pollution) and resulting diseases kill about 2 million children and causes about 300,000 to 700,000 premature deaths a year.
Many people suppose that rapid growth only comes with environmental degradation, and an improved environment can come only at the cost of reduced growth and development. • In some cases, this is true! • Rapid economic growth today may create pollution that reduces welfare and incurs cleanup costs in the future • If rapid growth today is possible only through depleting resource (forest: timber industry), growth may not be sustainable and may come at a very high cost. • Efforts to reduce pollution or better manage the environment can be costly, and hard choices need to be made weighing the costs and benefits.
In other cases, there in no trade-off! • development and environmental goals are complementary, and reducing environmental degradation can help lower production costs and directly improve economic output and welfare. • Ex. Reduced air and water pollution should support tourism, fisheries development, and agricultural production.
These issues take on greater meaning when going beyond national borders to consider the entire planet. • Running out of minerals (fuels) before we can develop technologies for renewable sources of energy • Heating earth atmosphere, emissions, changing world climate...
These issues take on greater meaning when going beyond national borders to consider the entire planet. • Running out of minerals (fuels) before we can develop technologies for renewable sources of energy • Heating earth atmosphere, emissions, changing world climate...
Market Failures • Environmental degradation is often a result of market failures: in which markets prices deviate from scarcity values and individuals and firms make decisions that maximize their own profits but cause losses for others and society as a whole • Within a single country, correcting those failures and establishing properly working, efficient markets can be among the most powerful and effective mechanisms to promote efficient resource use, reduce environment degradation, and generate sustainable development.
Environmental degradation often occurs because market participants do not take into account the full costs of their actions on the environment. • Ex: prices of goods produced in a factory may not include the costs to society of the air pollution generated by that factory. • Government policies and interventions aimed at incorporating these costs into market market decisions help improve environmental outcomes, make markets work better, and bring broader benefits to society.
Market failures affecting resources are externalities: costs borne by the population at large but not by individual producers and benefits that occur to society but cannot be captured by producers. • The most important externalities are those caused by the deletion or degrading of natural resources, including the environment • If resources are depleted at rates faster than they can be replenished or substituted by human made capital, development will be unsustainable
Why Markets Fail to Allocate Natural Resources Efficiently? • THE COMMONS: • A dilemma in which multiple individuals acting independently in their own self-interest can ultimately destroy a shared limited resource even when it is clear that it is not in anyone's long term interest for this to happen
The commons dilemma stands as a model for a great variety of resource problems in society today, such as water, land, fish, and non-renewable energy sources like oil and coal. • When fish consumption exceeds its reproductive capacity, or oil supplies are exhausted, then we face a tragedy of the commons. • When we include the environment as a common resource, then much private activity generates external costs and market failure becomes a very general phenomenon
EXTERNALITIES Polluters impose costs on others. If these external costs were reflected in firms costs, SMC would prevail. Price SMC S=PMC P2 P1 Quantity q2 q1
EXTERNALITIES The market price would be P2 and output Q2 Price SMC S=PMC P2 P1 Quantity q2 q1
EXTERNALITIES Because the firms do not bear those costs, their PMC is Lower, So more Q1 of the polluting product is produced and consumed Price SMC S=PMC P2 P1 Quantity q2 q1