Download
1 / 19
190 likes | 348 Vues
Day 3: An introduction to graphing. UDM Msc course in education & development 2013 NicholasSpaull@gmail.com – www.nicspaull.com/teaching. An introduction to graphing. What is a graph? A graph is a visual representation of information Why do we use graphs?

E N D
Day 3: An introduction to graphing UDM Msc course in education & development 2013 NicholasSpaull@gmail.com – www.nicspaull.com/teaching
An introduction to graphing • What is a graph? • A graph is a visual representation of information • Why do we use graphs? • Often information is easier to understand when in graphical format. We see patterns, trends and outliers easier than if we had a big data set full of numbers • What kinds of graphs are there? • Next slide
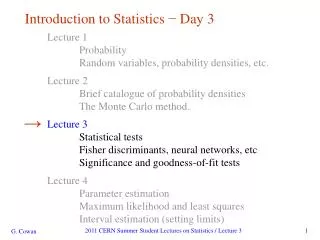
Some examples of graphs and how to interpret them • Line graphs • A line graph can help to show the relationship between two variables, or the trends in one or more variable over time/space. • In Zambia, what proportion of urban children reach Grade 9? Rural children? • In Swaziland, is the gap between rich and poor larger or smaller than the gap between boys and girls?
Line graphs Has the gap in life expectancy between White and Black males in the US increased or decreased over time? How much longer did White males live than Black males in 1970? http://www.ats.ucla.edu/STAT/stata/library/GraphExamples/code/line4.htm
Stacked area chart Useful to show how the composition of a whole has changed over time or some other category What proportion of household income was spent on personal insurance in 1986?
Pie charts • Which country has the highest proportion of children reaching higher order reading skills? • Which country has the lowest proportion of children that are either illiterate or unenrolled?
Bar chart – TIMSS 2011 Maths • What is the average mathematics score of quintile 5 children in South Africa? Do they perform better or worse than children in Romania? Lithuania? Morroco?
Bar Charts – Matric passes in South Africa • Which province has the third largest number of Grade 10 students? • Which province has the highest number of matric passes?
Infographics are graphs • A different kind of bar chart… The New York Times…
Enrolment pyramid by age & level of education • What proportion of 10 year old children from the poorest 20% of households in Tanzania are enrolled in primary school? • What proportion of 13 year old children from the richest 20% of households in South Africa are enrolled in secondary school? • What are some of the other features of these two graphs that stand out to you?
Population pyramids • Are Italians in the age range 25-29 more or less likely to be married than unmarried? • Are there more females who are widowed than males that are widowed? (what do you think could explain this? Do females kill their husbands?! ) • How will the shape of this population pyramid change in 30 years time? What are the implications?
How do population pyramids change shape? • Why do you think there was such a strong pyramid shape in these countries in the 1950s? How has it changed and why?
Colour-maps • Is China more or less unequal than India?
Venn Diagrams • Venn Diagrams • Venn diagrams show the extent to which different sets overlap and to what extent those overlaps are mutually exclusive or mutually inclusive
Tutorial quiz 2, 3 and 4 • Go to http://quizstar.4teachers.org/indexs.jsp • Enter your username and password • There are 3 quizzes in this section • Graphs (STACKED BAR GRAPHS) • Graphs (POPULATION PYRAMIDS) • Graphs (SCATTER PLOTS) • I would recommend completing them in this order • If you have any questions raise your hand and I will come and help you • For those not already registered you can register as a student on http://quizstar.4teachers.org/indexs.jsp and then search for my class ”UDM Msc Education” anyone can join the class