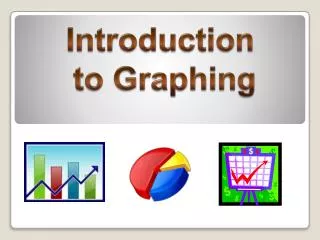
Introduction to Graphing
Introduction to Graphing. Graphs are pictures of information Graphs provide a fast and easy way to interpret data. Why use Graphs?. It’s important to choose the type of graph that best illustrates your data:. Bar Graph. Pie Graph. Line Graph. Best used for looking at

Introduction to Graphing
E N D
Presentation Transcript
Introduction to Graphing
Graphs are pictures of information • Graphs provide a fast and easy way to interpret data Why use Graphs?
It’s important to choose the typeofgraphthat best illustrates your data: Bar Graph Pie Graph Line Graph Best used for looking at changes over time (Trends) Best used for comparingdata quickly and easily Best used for Showing percentages (Parts of a Whole) Choosing the Right Graph
Rabbit Dietary Preferences Type: Pie Graph. Why: Because there are percentages or parts of a whole. Which type of graph would you use for the following data?
Monthly Science Grades 2010-2011 Which type of graph would you use for the following data? Type: Line Graph. Why: Because there is a change over time.
pH of Solutions – Unit 5 Chemistry Experiment Type: Bar Graph. Why: Because data is being compared. Which type of graph would you use for the following data?
Graphs require the correct ingredients, or components, to make them readable and understandable. For bar graphs and lines graphs, first set up your x-axis and y-axis using a ruler. The x-axis is horizontal The y-axis is vertical y-axis Components of a Good Graph x-axis
Components of a Good Graph The Dependent Variableis the data collected during the experiment. It Responds to the change in the independent variable. This is placed on the Y-axis. The thing that is Manipulatedby the experimenter, the Independent Variable, is placed on the X-axis. DRY MIX
Components of a Good Graph • Next choose a scale for each of the axes. • Select evenlyspacedintervals that include all of your data. • Always label your axis and include appropriate units where they apply. 2010 4th Quarter Profits Profit (in US Dollars) Month
Components of a Good Graph Include a legend when necessary to further clarify your data. Legend Texas California Nevada
Components of a Good Graph Finally, give your graph a Title • A title tells the reader what he or she is studying. • A good title should explain the relationship between variables. Texas California Nevada
Components of a Good Graph Pie graphs are shaped like a circle. • The size of each “slice” is determined by the percentage it will represent. • On the a pie graph, the independentvariable is whatever the slice of the pie represents, and the dependentvariable is the size of the pie slice, the percentage of the whole it represents.