2019 Deaf-Blind Child Count Kick-Off Webinar Overview
Join Robbin Bull, the DB Child Count Coordinator, for a detailed presentation on the 2019 Deaf-Blind Child Count. This webinar covers the collection and reporting processes, strategies for improving accuracy and efficiency, and how to utilize data effectively for decision-making. Learn about the history and significance of the annual count, which serves as a crucial registry for children with deaf-blindness. This session aims to enhance the quality of services provided to meet individual needs while ensuring accurate state-level needs assessment data is available.

2019 Deaf-Blind Child Count Kick-Off Webinar Overview
E N D
Presentation Transcript
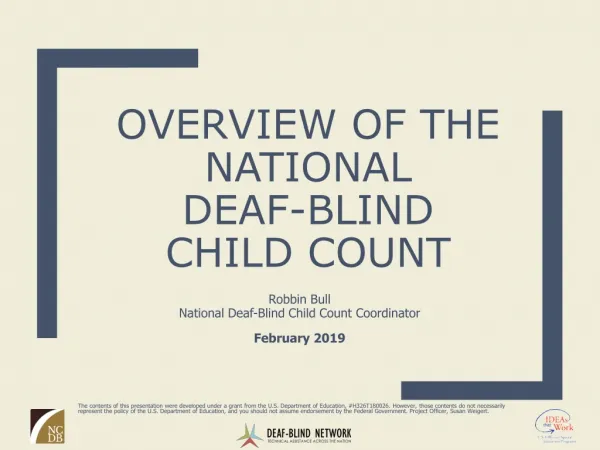
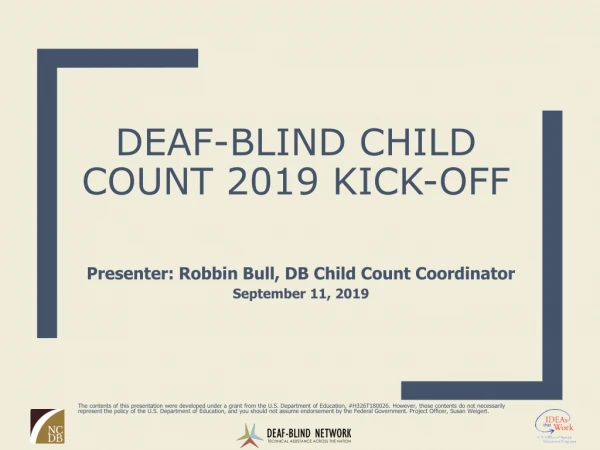
Deaf-Blind Child Count 2019 Kick-off Presenter: Robbin Bull, DB Child Count Coordinator September 11, 2019 The contents of this presentation were developed under a grant from the U.S. Department of Education, #H326T180026. However, those contents do not necessarily represent the policy of the U.S. Department of Education, and you should not assume endorsement by the Federal Government. Project Officer, Susan Weigert.
Webinar Outline • Deaf-Blind Child Count Overview • Collecting Child Count • Reporting Child Count • Using Child Count
Outcomes for Today Build knowledge of: • The collection and reporting process for the 2019 Deaf-Blind Child Count • Strategies to improve accuracy and efficiency in reporting • Strategies for using data to guide decisions • Plan for future changes – 2020 Count
History of the Annual Child Count • The December 1, 2019 Deaf-Blind Child Count will be the 33rd annual report • It represents a “snapshot” count on December 1st of each year to supplement OSEP’s federal Child Count, which includes children as deaf-blind when deaf-blindness represents their only disability • It is the first, and longest running, registry and knowledge base for children who are deaf-blind
Why do we collect this information? • To assure current and accurate state-level needs assessment data is available and used in the design and delivery of TA • To inform current research needs and personnel preparation. • So that…all children who are deaf-blind are getting the highest quality services available to meet their individual needs.
2019 Deaf-Blind Child Count (DBCC) Timeline September 2019 NCDB disseminates all DBCC materials. December 1, 2019 DBCC “Snapshot” date May 5, 2020 DBCC data due to NCDB May – Sept 2020 Data verification and cleaning activities November 2020 National Report data published
Submission Details • The Deaf-Blind Child Count Reporting Packet consists of three documents. • I-1 Instructions (added details throughout) • C-1 Quick Reference Code Sheet • S-1 Sample Spreadsheet (includes 2 additional sheets) • Data can be collected in any spreadsheet or database program as long as the required fields can be saved and/or exported into a format that can be opened in Microsoft Excel, for example .csv, .xls, or .xlsx • All data are due by May 5, 2020 for inclusion in the National Deaf-Blind Child Count unless an extension is requested and granted. • Data will be submitted via the National Center website via a secure portal. Visit the Annual Resources for Reporting the Child Count web page for submission instructions.
Double check for proper codes/missing data • Nothing new - BUT REVIEW INSTRUCTIONS AND CODE SHEETS – National and project-created • ED Setting - Use same codes as last year* • Check State Assessment (4 & 5) • Exiting data - keep all data for last year of exit • Be sure Intervener Services (Col 35) included *Be sure to review notes related to Educational Setting codes
Reporting Considerations (1 of 2) • Date of birth, vision loss and hearing loss information is needed to be included on the child count (Further testing needed on VL & HL is allowed one year only) • Data reporting period is December 2, 2018 – December 1, 2019. The “snapshot” date is December 1, 2019 • Individuals identified after December 1, 2019 should not be included on this count • Projects must report Exiting data on students/children who left special education or quit receiving State Deaf-Blind Project services in the 12 months preceding December 1, 2019 • Use the code of 999 in any numeric field for any unknown data
Reporting Considerations (2 of 2) • Only numeric data will be accepted for all fields except state code, ID Number and Child Number • Do not include more than one code in any field • Do not include any data notes in numeric data sheet. Notes can be included in Data Notes sheet or separate file • Please contact me before the submission date if you will be unable to meet the submission deadline • Remember all data is due May 5
Ed Setting “New Codes” vs. “Old Codes” “New Codes” is mis-leading. We are NOT using them for 2019. • They were introduced in the instructions in 2017 and included in the 2018 instructions • Usage was missed by a number of states, or implemented improperly • We reverted to the “Old Codes” for national reporting purposes for 2018 and 2019 • “New Codes” will be implemented with the 2020 changes
Ed Setting field cautions • Age 3-5 settings and Age 6-21 settings have different codes – but go into the same field • Must be aware of child age to enter correct code • Current set-up, changes to codes for one group (3-5) affected codes for other group (6-21) • Data can be incorrect due to out of age range, improper code updates – partial updates or form mis-match
Ed Setting “Old Codes”** Codes that will be used on 2019 national report ECSE (3-5) Settings • Attending a regular early childhood program at least 80% of the time • 2. Attending a regular early child hood program 40% to 79% of the time • Attending a regular early childhood program less than 40% of the time • Attending a separate class • Attending a separate school • Attending a residential facility • Service provider location • Home School aged (6-21) settings • Inside the regular class 80% or more of day • Inside the regular class 40% to 79% of day • Inside the regular class less than 40% of day • Separate school • Residential facility • Homebound/Hospital • Correctional facilities • Parentally placed in private school Educational Setting (3-21)
Ed Setting “New Codes”**Only use if used for 2018 reporting ECSE (3-5) Settings • In a regular EC program 10+ hours/week with services • In a regular EC program 10+ hours/week – services elsewhere • In a regular EC program less than 10 hours/week with services • In a regular EC program less than 10 hours/week – services elsewhere • Attending a separate class • Attending a separate school • Attending a residential facility • Service provider location • Home School aged (6-21) settings • Inside the regular class 80% or more of day • Inside the regular class 40% to 79% of day • Inside the regular class less than 40% of day • Separate school • Residential facility • Homebound/Hospital • Correctional facilities • Parentally placed in private school Educational Setting (3-21)
Ed Setting Procedures When you reported the 2018 child count… • If used old codes, no updates should be made • If updated to the new codes for all kids, no changes needed - I will cross-walk data into the old codes when submitted • If mixed/potentially mixed codes, I will work with projects to ascertain which codes are new and which are old. Any new codes found will be cross-walked into the old codes **All states will be required to submit the Ed Setting codes used along with data file for 2019 DB Child Count.**
Update data records • NCDB will provide data notes for issues related to your file from previous year, if any. (If you do not receive a copy of these notes, there were no data issues identified.) Check these notes for updates needed for your file.
Ways to evaluate your data for accuracy (1 of 2) • UNKNOWN/MISSING: Look for a high number of unknown/missing data for your state. (This can easily be done using the online national reports.) Does that seem to match what you expect? If not, is your database exporting all data? • DATA NOT EXPORTED: State data file: Scan exported Excel data for empty columns or minimal data where full data is expected. If no data/minimal data, is your database exporting all data? • CODED FOR CORRECT AGE: In Excel, sort current state data file by age and look at Part C/B codes and EI/ Ed Setting codes (0-2, 3-5, 6-21) to see if codes are appropriate for age of child. Often the 6-21 code is used in place of the 3-5 code and vice versa.
Ways to evaluate your data for accuracy (2 of 2) • ONLY NUMERIC CODES: Look for any non-numeric codes and/or multiple codes in one cell. All cells should have only one numeric code reported. (State and Child Code are alpha) • CHANGES ACROSS YEARS: Add a year field to your data then add last year’s data to your file. Color code by year, then sort by Byr, Bmth, Bday, ChildID, ChildNum. Easily view differences across years. You can also quickly see any children added, or removed. (Contact Robbin if you want help with this.) • FURTHER TESTING NEEDED: Using a multi-year file assists you in checking if an individual has a code 7 (Further Testing Needed - allowed 1 year only) in the Documented Vision Loss and Documented Hearing Loss fields.
Newly Identified Children Common Project Measures • Simple formula: Percent = 1a/1b * 100 • 1a. The number of newly identified children with deaf-blindness in your state reported to NCDB for the annual National Child Count. • 1b. The total number of children with deaf-blindness in your state reported to NCDB for the annual National DB Child Count. • Be sure you have the most updated copy (April 2019) • Ways to determine: 1) New field in database; 2) Merge and sort spreadsheet file
Ways to Look at Data • Lens of child data • Who are the children – extent of vision loss, hearing loss, specific etiologies, other disabilities? • Lens of service data • Where are the children being served and how does this impact technical assistance and training needs? • Longitudinally • What are trends telling us about the changing needs of children and families?
Tools available to look at your data • Annual Online Report - Filter your data - compare with National, get report of all individual state data in downloadable report • Quick look at your state data, and quick charts and tables • Allow you to download and generate state level reports • Interactive Online Maps - Quickly look at your child count across years with pop up longitudinal graph, drill down by number or percent. • Nice graphics for reports/presentations • Percentage tables • Longitudinal Data File- Hearing Loss by Vision Loss (2010-2017) • Individual state tables and charts as well as national • Generate trend reports, charts and graphs • EI&R Self-Assessment Guide - Guide, but pre-populated data tables are also helpful. • Compare your state against Part C proportions (Table 1) • Compare your state against national DB proportions (Table 2) • Compare your state against national DB age distribution (Table 3) • Compare percent change between ages against national DB (Table 4) More details about using these tools are on our website.
DBCC Needs Assessment Workgroup • 2006 was the last major review of data fields • What revisions are necessary? What are desired? • Workgroup recommendations will be presented to field for feedback • Implementation on 12-1-2020 DBCC
I’m Here to Help! Don’t hesitate to contact Robbin with questions.
EVALUATION Help us provide better services to you by providing your feedback. Evaluation link: https://tinyurl.com/y2wbchgb