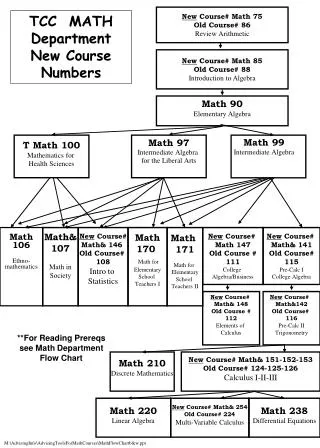
Math 119: Elementary Statistics
Math 119: Elementary Statistics. Lecture 01: Course Introduction, Describing Distributions Graphically Aug 19/20, 2013. Overview. Syllabus MyStatLab Course overview: relevance of statistics Chapter 1: Exploring Data. Math 119 Course Description.

Math 119: Elementary Statistics
E N D
Presentation Transcript
Math 119: Elementary Statistics Lecture 01: Course Introduction, Describing Distributions Graphically Aug 19/20, 2013
Overview • Syllabus • MyStatLab • Course overview: relevance of statistics • Chapter 1: Exploring Data
Math 119 Course Description • Exploratory data analysis: graphical and numerical exploration of real data with a heavy dose of common sense. Measures of center (mean, median) and spread (quartiles, variance and standard deviation). • Simulation: used throughout the course to develop an understanding of randomness, even before an introduction to probability. As an example, students might consider the tradeoff between risk and reward in investments, using simulations to compare a portfolio of risky stocks with a savings account.
Math 119 • Meeting Times • Lecture: • 2 meetings/week M/W or T/Th • Webpages: • http://swccd.blackboard.com • http://mystatlab.com • http://www.swccd.edu/~bsmith
Contact Info • Instructor: Bruce Smith • Phone: 421-6700, x5291 • e-mail: bsmith@swccd.edu • Office: 320F
Textbook and Materials • Required: • “Elementary Statistics Using theTI-83/84 Plus Calculator, 3rd edition”, by Mario F. Triola • For Homework/Quizzes • mystatlab.com/ • Purchased separately, or packaged together at SWC bookstore
Other Resources • The Khan Academy is a great reference • Udacity
Evaluation Policy: “What grade must I get on the final exam to get a A/B/C?” • Semester Grade Evaluation Policy Quizzes (10)20% Exams (3)45% Math XL HW 20% Final Exam 15% Total: 100% grade = 0.20 * avg_q+ 0.45 * avg_exam + 0.2* hw_avg + 0.15 * final_exam excuse reducer: lowest quiz, lowest exam dropped (based on attendance, see next slides)
Attendance • You can be dropped if you have more than 4 absences • but don’t just stop attending class during the last weeks of class; a failing grade will be given, not a DR • Lowest quiz and exam scores will be dropped for those with no more than 2 absences • if absent for a quiz or exam, these will be your “freebies.” • Student: “My friend is getting married and I have to miss class next week. Can I make up the exam?” • Me: “Enjoy the wedding. If there’s an exam or quiz that you missed, then this will be your freebie. No makeupsallowed.” (unless it’s a college sanctioned event)
DSS • Please see me within the first week of class if there are special needs • Or call DSS at • Voice: (619) 482-6512 • TTY: (619) 482-6740
Class Policies • No food or drink (water bottles OK) • Cell phones silent • No children or visitors without prior permission
Class Policies • “penalty grades” • If you are found cheating or helping someone cheat, you may receive as much as (–)50% of the assignment’s value • Students (both the giver and the receiver) involved in cheating and/or plagiarism will receive a “penalty grade” on the assignment and, at the discretion of the instructor, earn a failing grade in the class. • Also see SWC Course Catalog regarding student conduct.
Does social distress cause pain? Enter this data into L1 and L2 of your TI calculator
Data • observations that have been collected • gender • eye color • voting preference • weight
Statistics • a collection of methods for • planning studies and experiments, obtaining data, and then • organizing, summarizing, presenting, analyzing, interpreting, and drawing conclusions based on the data
Why do you care about these questions? Do angry people have more heart disease? Are students that successfully complete online classes better students in general? Why is it that economically disadvantaged kids perform better academically if pre-school they attended preschool? Does drinking red wine reduce risk of heart attack? Who is likely to win the next election? Will reading stories daily to my child help her become a better learner and a more capable student?
Statistical Thinking • Data beat anecdotes • Always look at the data • two B-ball teams, same avg ht • Beware the lurking variable • class A or B spends more time on facebook? • Where the data come from is important • Variation is everywhere • Conclusions are not certain