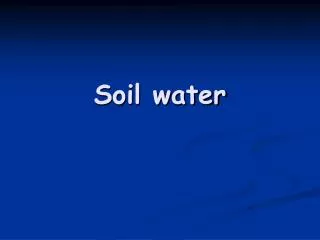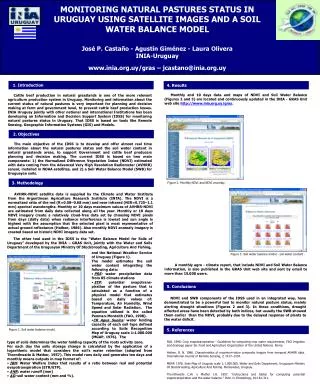
Figure 1. Soil water balance model.
10 likes | 222 Vues
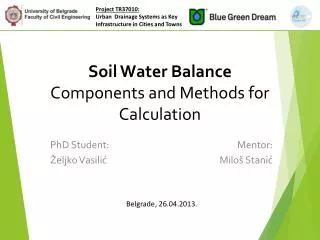
MONITORING NATURAL PASTURES STATUS IN URUGUAY USING SATELLITE IMAGES AND A SOIL WATER BALANCE MODEL José P. Castaño - Agustín Giménez - Laura Olivera INIA-Uruguay www.inia.org.uy/gras – jcastano@inia.org.uy. 1. Introduction. 4. Results.

Figure 1. Soil water balance model.
E N D
Presentation Transcript
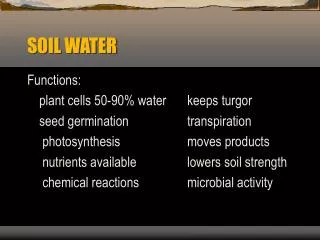
MONITORING NATURAL PASTURES STATUS IN URUGUAY USING SATELLITE IMAGES AND A SOIL WATER BALANCE MODEL José P. Castaño - Agustín Giménez - Laura Olivera INIA-Uruguay www.inia.org.uy/gras – jcastano@inia.org.uy 1.Introduction 4. Results Monthly and 10 days data and maps of NDVI and Soil Water Balance (Figures 2 and 3) are located and continuously updated in the INIA - GRAS Unit web site http://www.inia.org.uy/gras. Cattle beef production in natural grasslands is one of the more relevant agriculture production system in Uruguay. Monitoring and information about the current status of natural pastures is very important for planning and decision making at farm and government level, to prevent cattle beef production losses. INIA Uruguay jointly with other national and international Institutions has been developing an Information and Decision Support System (IDSS) for monitoring natural pastures status in Uruguay. That IDSS is based on tools like Remote Sensing, Geographic Information Systems (GIS) and Models. 2. Objectives The main objective of the IDSS is to develop and offer almost real time information about the natural pastures status and the soil water content in natural grasslands areas, to support Government and cattle beef producers planning and decision making. The current IDSS is based on two main components: 1) the Normalized Difference Vegetation Index (NDVI) estimated with data coming from the Advanced Very High Resolution Radiometer (AVHRR) sensor, installed in NOAA satellites, and 2) a Soil Water Balance Model (SWB) for Uruguayan soils. 3. Methodology Figure 2. Monthly NDVI and NDVI anomaly. AVHRR-NDVI satellite data is supplied by the Climate and Water Institute from the Argentinean Agriculture Research Institute (INTA). The NDVI is a normalized ratio of the red (R=0.58–0.68 mm) and near infrared (NIR=0.725–1.1 mm) spectral wavelengths. Monthly or 10 days maximum values of AVHRR-NDVI are estimated from daily data collected along all the year. Monthly or 10 days NDVI imagery create a relatively cloud-free data set by choosing NDVI pixels from days (daily data) when radiance interference is lowest and sun angle is highest with the assumption that the selected pixel is most representative of actual ground reflectance (Holben, 1986). Also monthly NDVI anomaly imagery is created based on historic NDVI imagery data set. The other tool used in the IDSS is the “Water Balance Model for Soils of Uruguay” developed by the INIA – GRAS Unit, jointly with the Water and Soils Department of the Uruguayan Ministry Of Stockbreeding, Agriculture And Fishing, • and the National Weather Service of Uruguay (Figure 1). • The model estimates the soil water content integrating the following data: • PRE: water precipitation data from 85 climate stations • ETP: potential evapotrans-piration of the pasture that is calculated as a function of a physical model that estimates based on daily values of: Temperature, Air Humidity, Wind Speed and Solar Radiation. The equation utilized is the called Penman-Monteith (FAO, 1998). • CR Agua Suelos: water holding capacity of each soil type defined according to Soils Recognition Map of Uruguay scale 1:1.000.000 (MGAP, 1976). The Figure 3. Soil water balance model - soil water content . A monthly agro - climate report, that include NDVI and Soil Water Balance information, is also published in the GRAS Unit web site and sent by email to more than 15.000 users. 5. Conclusions NDVI and SWB components of the IDSS used in an integrated way, have demonstrated to be a powerful tool to monitor natural pasture status, mainly alerting drought situations (Figures 2 and 3). In these conditions, drought affected areas have been detected by both indices, but usually the SWB showed them earlier than the NDVI, probably due to the delayed response of plants to the water deficit. 5. References Figure 1. Soil water balance model. • type of soils determines the water holding capacity of the roots activity zone. • For each day the soils storage change is calculated by the application of a logarithmic model that considers the soil’s water retention (adapted from Thornthwaite & Mather, 1957). This model runs daily and generates ten days and monthly means outputs in map format of: • IBH: Water Welfare Index that results of a ratio between real and potential evapotranspiration (ETR/ETP). • ANR: water runoff (mm) • AD: soil water content (mm and %). FAO. 1998. Crop evapotranspiration - Guidelines for computing crop water requirements. FAO Irrigation and drainage paper 56. Food and Agriculture Organization of the United Nations. Rome. Holben, B. N. 1986. Characteristics of maximum-value composite images from temporal AVHRR data. International Journal of Remote Sensing, 7, 1417–1434. MGAP. 1976. Soils Map of Uruguay scale 1:1.000.000. Water and Soils Department, Uruguayan Ministry Of Stockbreeding, Agriculture And Fishing. Montevideo, Uruguay. Thornthwaite C.W. y Mather J.R. 1957. "Instructions and tables for computing potential evapotranspiration and the water balance." Publ. in Climatology, 10:181-311.