Download
1 / 36
460 likes | 1.07k Vues
Presentation 21. Software quality metrics. Objectives of quality measurement Classification of software quality metrics Process metrics Product metrics Implementation of software quality metrics Limitations of software metrics The function point method. IEEE definitions of

E N D
Presentation 21 Software quality metrics • Objectives of quality measurement • Classification of software quality metrics • Process metrics • Product metrics • Implementation of software quality metrics • Limitations of software metrics • The function point method
IEEE definitions of software quality metrics (1) A quantitative measure of the degree to which an item possesses a given quality attribute. (2) A function whose inputs are software data and whose output is a single numerical value that can be interpreted as the degree to which the software possesses a given quality attribute.
Main objectives of software quality metrics 1. Facilitate management control, planning and managerial intervention.Based on: · Deviations of actual from planned performance. · Deviations of actual timetable and budget performance from planned. 2. Identify situations for development or maintenance process improvement (preventive or corrective actions). Based on: · Accumulation of metrics information regarding the performance of teams, units, etc.
Software quality metrics — Requirements General requirements • Relevant • Valid • Reliable • Comprehensive • Mutually exclusive Operative requirements • Easy and simple • Does not require independent data collection • Immune to biased interventions by interested parties
Classifications of software quality metrics Classification by phases of software system • Process metrics – metrics related to the software development process • Product metrics – metrics related to software maintenance Classification by subjects of measuements • Quality • Timetable • Effectiveness (of error removal and maintenance services) • Productivity
Software size (volume) measures • KLOC — classic metric that measures the size of software by thousands of code lines. • Number of function points(NFP) — a measure of the development resources (human resources) required to develop a program, based on the functionality specified for the software system.
Error counted measures Number of code errors (NCE) vs. weighted number of code errors (WCE)
Process metrics categories Process metrics categories • Software process quality metrics • Error density metrics • Error severity metrics • Software process timetable metrics • Software process error removal effectiveness metrics • Software process productivity metrics
Error density metrics NCE = The number of code errors detected by code inspections and testing. NDE = total number of development (design and code) errors) detected in the development process. WCE = weighted total code errors detected by code inspections and testing. WDE = total weighted development (design and code) errors detected in development process.
Error severity metrics NCE = The number of code errors detected by code inspections and testing. NDE = total number of development (design and code) errors) detected in the development process. WCE = weighted total code errors detected by code inspections and testing. WDE = total weighted development (design and code) errors detected in development process.
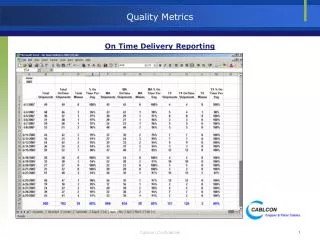
Software process timetable metrics MSOT = Milestones completed on time. MS = Total number of milestones. TCDAM = Total Completion Delays (days, weeks, etc.) for all milestones.
Error removal effectiveness metrics NDE = total number of development (design and code) errors) detected in the development process. WCE = weighted total code errors detected by code inspections and testing. WDE = total weighted development (design and code) errors detected in development process. NYF = number software failures detected during a year of maintenance service. WYF = weighted number of software failures detected during a year of maintenance service.
Process productivity metrics DevH = Total working hours invested in the development of the software system. ReKLOC = Number of thousands of reused lines of code. ReDoc = Number of reused pages of documentation. NDoc = Number of pages of documentation.
Product metrics categories * HD quality metrics: * HD calls density metrics - measured by the number of calls. * HD calls severity metrics - the severity of the HD issues raised. * HD success metrics – the level of success in responding to HD calls. * HD productivity metrics. * HD effectiveness metrics. * Corrective maintenance quality metrics. * Software system failures density metrics * Software system failures severity metrics * Failures of maintenance services metrics * Software system availability metrics * Corrective maintenance productivity and effectiveness metrics.
HD calls density metrics NHYC = the number of HD calls during a year of service. KLMC = Thousands of lines of maintained software code. WHYC = weighted HD calls received during one year of service. NMFP = number of function points to be maintained.
Severity of HD calls metrics NHYC = the number of HD calls during a year of service. WHYC = weighted HD calls received during one year of service.
HD success metrics NHYNOT = Number of yearly HD calls completed on time during one year of service. NHYC = the number of HD calls during a year of service.
HD productivity and effectiveness metrics HDYH = Total yearly working hours invested in HD servicing of the software system. KLMC = Thousands of lines of maintained software code. NMFP = number of function points to be maintained. NHYC = the number of HD calls during a year of service.
Software system failures density metrics NYF = number of software failures detected during a year of maintenance service. WYF = weighted number of yearly software failures detected during one year of maintenance service. NMFP = number of function points designated for the maintained software. KLMC = Thousands of lines of maintained software code.
Software system failure severity metrics NYF = number of software failures detected during a year of maintenance service. WYF = weighted number of yearly software failures detected during one year.
Failures of maintenance services metrics NYF = number of software failures detected during a year of maintenance service. RepYF = Number of repeated software failure calls (service failures).
Software system availability metrics NYSerH = Number of hours software system is in service during one year. NYFH = Number of hours where at least one function is unavailable (failed) during one year, including total failure of the software system. NYVitFH = Number of hours when at least one vital function is unavailable (failed) during one year, including total failure of the software system. NYTFH = Number of hours of total failure (all system functions failed) during one year. NYFH ≥ NYVitFH ≥ NYTFH. 1 – TUA ≥ VitA ≥FA
Software corrective maintenance productivity and effectiveness metrics CMaiYH = Total yearly working hours invested in the corrective maintenance of the software system. NYF = number of software failures detected during a year of maintenance service. NMFP = number of function points designated for the maintained software. KLMC = Thousands of lines of maintained software code.
The process of defining software quality metrics
General limitations of quality metrics * Budget constraints in allocating the necessary resources. * Human factors, especially opposition of employees to evaluation of their activities. * Validity Uncertainty regarding the data's, partial and biased reporting.
Examples of software metrics that exhibit severe weaknesses * Parameters used in development process metrics: KLOC, NDE, NCE. * Parameters used in product (maintenance) metrics: KLMC, NHYC, NYF.
Factors affecting parameters used for development process metrics a. Programming style (KLOC). b. Volume of documentation comments (KLOC). c. Software complexity (KLOC, NCE). d. Percentage of reused code (NDE, NCE). e. Professionalism and thoroughness of design review and software testing teams: affects the number of defects detected (NCE). f. Reporting style of the review and testing results: concise reports vs. comprehensive reports (NDE, NCE).
Factors affecting parameters used for product (maintenance) metrics a. Quality of installed software and its documentation (NYF, NHYC). b. Programming style and volume of documentation comments included in the code be maintained (KLMC). c. Software complexity (NYF). d. Percentage of reused code (NYF). e. Number of installations, size of the user population and level of applications in use: (NHYC, NYF).
The function point method The function point method The function point estimation process: • Stage 1: Compute crude function points (CFP). • Stage 2: Compute the relative complexity adjustment factor (RCAF) for the project. RCAF varies between 0 and 70. • Stage 3: Compute the number of function points (FP): FP = CFP x (0.65 + 0.01 x RCAF)
Crude function points (CFP) – calculation form
Relative complexity adjustment factor (RCAF) – form
The ATTEND MASTER - Data Flow Diagram
The ATTEND MASTER CFP calculation form
The ATTEND MASTER RCAF calculation form
The ATTEND MASTER – function points calculation The ATTEND MASTER – function points calculation FP = CFP x (0.65 + 0.01 x RCAF) FP = 81 x (0.65 + 0.01 x 41) = 85.86
The function point method – advantages and disadvantages Main advantages • Estimates can be prepared at the pre-project stage. • Based on requirement specification documents (not specific dependent on development tools or programming languages), the method’s reliability is relatively high. Main disadvantages • FP results depend on the counting instruction manual. • Estimates based on detailed requirements specifications, which are not always available. • The entire process requires an experienced function point team and substantial resources. • The evaluations required result in subjective results. • Successful applications are related to data processing. The method cannot yet be universally applied.