Download
1 / 22
230 likes | 556 Vues
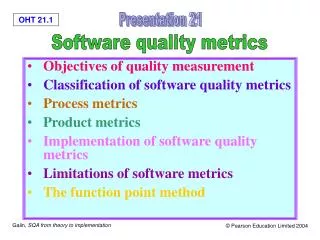
Software Quality Metrics. What do you measure?. Ch 4 in Kan Steve Chenoweth, RHIT. How do we know if it’s “quality”?. Mean time to failure Defect density Customer problems Customer satisfaction. Do you see “quality” here?. ANSI 982.2.

E N D
Software Quality Metrics What do you measure? Ch 4 in Kan Steve Chenoweth, RHIT
How do we know if it’s “quality”? • Mean time to failure • Defect density • Customer problems • Customer satisfaction Do you see “quality” here?
ANSI 982.2 • An error is a human mistake that results in incorrect software. • The resulting fault is an accidental condition that causes a unit of the system to fail to function as required. • A defect is an anomaly in a product. • A failure occurs when a functional unit of a software-related system can no longer perform its required function or cannot perform within its specified limits.
Can we compare? • Defect rate for product 1 vs defect rate for product 2? • Need to “operationalize” the two numbers: • How many “opportunities for error” (OPEs) during a specified time? • Often have to compare “failures” instead • Infer defects • Time frames need to be similar – • Lots more defects right after release
Can we even compare LOC? • Are LOC like IQ points – people use them just because they are handy? • Does coding style count, etc.? • “Everyone knows that debugging is twice as hard as writing a program in the first place. So if you are as clever as you can be when you write it, how will you ever debug it?” ―Brian Kernighan
How about this question? • In a next release of a product, what do you count? • All lines shipped to each customer? • Just the lines changed? • Something in-between? “ A whole nuther way” to consider what counts…
The customer doesn’t care! • They want a decreasing defect rate, over time. • They’ll get spoiled by a good release that had little new stuff in it.
How about function points? • Another way to consider “opportunities for error” (OPEs). • Uses a weighted total of 5 major components: • Number of external inputs x 4 • Number of external outputs x 5 • Number of internal files x 10 • Number of external interface files x 7 • Number of external inquiries x 4
Problems per user-month (PUM) • Problems reported / total license-months • Usually measured after release
Customer Satisfaction Metrics • Often a 5-point scale: • Can be overall, or • For specific qualities. • HP uses “FURPS”: • Functionality • Usability • Reliability • Performance • Service
Customer Sat • Can be expressed to the customer as a question, in different ways: • Completely satisfied? • Satisfied? • Dissatisfied? • Neutral or worse? Most commonly asked for
Relative scope of the 3 metrics • These are subset relationships
Study of quality processes • The model is from machine testing • We look at defect arrival pattern. • Good – arrivals stabilize at low level!
In software, can track in all phases • Moving from phase to phase, this also yields defect removal rates. • Which of these patterns is better?
Looking at it in a good way… • “Phase effectiveness” • Tall bars = low number of defects escaped
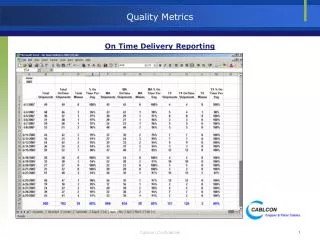
Maintenance – worth measuring • Typical metrics looked at carefully: • Fix backlog and backlog management index • Fix response time and fix responsiveness • Percent delinquent fixes • Fix quality
Fix backlog • Open versus closed problems • Backlog management index by month
Fix response time / responsiveness • Mean time of all problems from open to closed • Believed short response times customer satisfaction • Closely related – percent “delinquent” fixes
Fix quality • Number of defective fixes: • Didn’t fix the reported problem, or • Fixed it but injected a new defect.
Company “metrics programs” • Ok, we all have different ones! • Motorola, for example: • Includes “SEA” – Schedule Estimation Accuracy • Etc. • HP: • Average fixed defects/working day • Etc. • IBM Rochester: • Fix response time • Etc.
Collecting data • Expensive • Needs consistency • Should be targeted • Often use forms and checklists • See pp 117 - 123
So, what do you use? • How formal are your measurements? • How consistently applied? • How much time does it take? • Who reviews the data? • Who makes process changes? • See Kan’s “Recommendations for small organizations,” pp 124-5.