Download
1 / 26
270 likes | 453 Vues
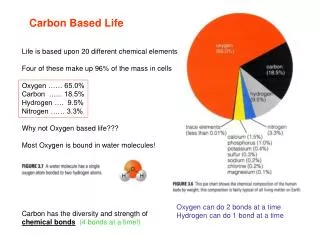
1. Carbon-Based Fuels and the Environment. Hybrid and Alternative Fuel Vehicles, Third Edition James D. Halderman. FIGURE 1.1 The underhood decal showing that this Lexus RX-330 meets both National (Tier 2; BIN 5) and California LEV-II (ULEV) regulation standards.

E N D
1 Carbon-Based Fuelsand the Environment Hybrid and Alternative Fuel Vehicles, Third Edition James D. Halderman
FIGURE 1.1 The underhood decal showing that this Lexus RX-330 meets both National (Tier 2; BIN 5) and California LEV-II (ULEV) regulation standards.
CHART 1.1 LEV Standard CategoriesNOTE: Are 100,000-mile standards for LEV I, and 120,000-mile standards for LEV II. NMOG means non-methane organic gases, which includes alcohol. CO means carbon monoxide. NOX means oxides of nitrogen. PM means particulate matter, also known as soot. Source: Data compiled from California Environmental Protection Agency—Air Resource Board (CARB) documents.
CHART 1.2 California LEV II 120,000-Mile Tailpipe Emissions LimitsNOTE: Are 100,000-mile standards for LEV I, and 120,000-mile standards for LEV II. NMOG means non-methane organic gases, which includes alcohol. CO means carbon monoxide. NOX means oxides of nitrogen. PM means particulate matter, also known as soot. The specification is in grams per mile (g/mi). Source: Data compiled from California Environmental Protection Agency—Air Resource Board (CARB) documents.
CHART 1.3 EPA Tier 2 120,000-Mile Tailpipe Emission LimitsNOTE: The bin number is determined by the type and weight of the vehicle. After January 1, 2007, the highest Bin Number allowed is Bin 8. Source: Data compiled from the Environmental Protection Agency (EPA).
CHART 1.4 Air Pollution Score U.S. EPA Vehicle Information Program (The higher the score, the lower the emissions.)Source: Courtesy of EPA.
CHART 1.5 Greenhouse Gas Score*CNG assumes a gallon equivalent of 121.5 cubic feet.Source: Courtesy of EPA.
FIGURE 1.2 This label on a Toyota Camry hybrid shows the relative smog-producing emissions, but this does not include carbon dioxide (CO2), which may increase global warming.
FIGURE 1.3 The atmosphere allows radiation to pass through to the earth’s surface and blocks the release of heat back into space if there is too high a concentration of greenhouse gases.
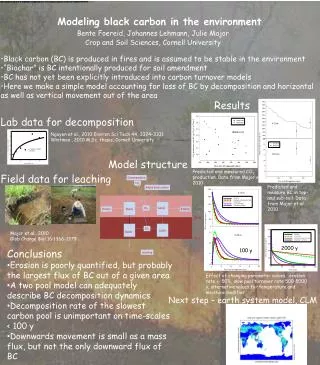
FIGURE 1.4 The chart shows that the atmospheric concentration of greenhouse gases due to human sources (anthropogenic) such as the burning of carbon-based fuel is increasing. (Courtesy of Oakridge Labs)
FIGURE 1.5 Acid rain is formed when sulfur dioxide (SO2) and oxides of nitrogen (NOX) combine with rain, forming acids.
FIGURE 1.6 The sidewalk section at the top is about 20 years old and shows the effects of acid rain, as comparedto the lower section, which is about 5 years old. Notice that the acid rain has eroded the cement, leaving the aggregate (stones) exposed on the upper section.
FIGURE 1.7 Notice that the temperature has risen and fallen over time, but the levels of CO2 in the atmosphere have never been higher and are thought to be the cause of global warming. (Courtesy of the EPA)
FIGURE 1.8 Pumping carbon dioxide back into the earth not only reduces the amount released to the atmosphere but also helps force more crude oil to the surface, thereby increasing the efficiency of existing wells.
FIGURE 1.9 Carbonated water is usually the most common (first listed) ingredient in soft drinks and other carbonated beverages.