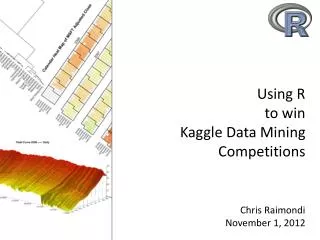
Using R to win Kaggle Data Mining Competitions
Using R to win Kaggle Data Mining Competitions. Chris Raimondi November 1, 2012. Overview of talk. What I hope you get out of this talk Life before R Simple model example R programming language Background/Stats/Info How to get started Kaggle. Overview of talk.

Using R to win Kaggle Data Mining Competitions
E N D
Presentation Transcript
Using R to winKaggle Data Mining Competitions Chris Raimondi November 1, 2012
Overview of talk • What I hope you get out of this talk • Life before R • Simple model example • R programming language • Background/Stats/Info • How to get started • Kaggle
Overview of talk • Individual Kaggle competitions • HIV Progression • Chess • Mapping Dark Matter • Dunnhumby’s Shoppers Challenge • Online Product Sales
What I want you to leave with • Belief that you don’t need to be a statistician to use R - NOR do you need to fully understand Machine Learning in order to use it • Motivation to use Kaggle competitions to learn R • Knowledge on how to start
My life before R • Lots of Excel • Had tried programming in the past – got frustrated • Read NY Times article in January 2009 about R & Google • Installed R, but gave up after a couple minutes • Months later…
My life before R • Using Excel to run PageRank calculations that took hours and was very messy • Was experimenting with Pajek – a windows based Network/Link analysis program • Was looking for a similar program that did PageRank calculations • Revisited R as a possibility
My life before R • Came across “R Graph Gallery” • Saw this graph…
Addicted to R in one line of code pairs(iris[1:4], main="Edgar Anderson's Iris Data", pch=21, bg=c("red", "green3", "blue")[unclass(iris$Species)]) “pairs” = function “iris” = dataframe
What do we want to do with R? • Machine learning • a.k.a. – or more specifically • Making models • We want to TRAIN a set of data with KNOWN answers/outcomes • In order to PREDICT the answer/outcome to similar data where the answer is not known
How to train a model R allows for the training of models using probably over 100 different machine learning methods To train a model you need to provide Name of the function – which machine learning method Name of Dataset What is your response variable and what features are you going to use
Code used to train decision tree library(party) irisct <- ctree(Species ~ Sepal.Length + Sepal.Width + Petal.Length + Petal.Width, data = iris) Or use “.” to mean everything else - as in… irisct <- ctree(Species ~ ., data = iris)
That’s it You’ve trained your model – to make predictions with it – use the “predict” function – like so: my.prediction <- predict(irisct, iris2) To see a graphic representation of it – use “plot”. plot(irisct) plot(irisct, tp_args = list(fill = c("red", "green3", "blue")))
R background • Statistical Programming Language • Since 1996 • Powerful – used by companies like Google, Allstate, and Pfizer. • Over 4,000 packages available on CRAN • Free • Available for Linux, Mac, and Windows
Learn R – Starting Tonight • Buy “R in a Nutshell” • Download and Install R • Download and Install Rstudio • Watch 2.5 minute video on front page of rstudio.com • Use read.csv to read a Kaggle data set into R
Learn R – Continue Tomorrow • Train a model using Kaggle data • Make a prediction using that model • Submit the prediction to Kaggle
Learn R – This Weekend • Install the Caret package • Start reading the four Caret vignettes • Use the “train” function in Caret to train a model, select a parameter, and make a prediction with this model
Buy This Book: R in a Nutshell Excellent Reference 2nd Edition released just two weeks ago In stock at Amazon for $37.05 Extensive chapter on machine learning
R Tip Read the vignettes – some of them are golden. There is a correlation between the quality of an R package and its associated vignette.
What is kaggle? • Platform/website for predictive modeling competitions • Think middleman – they provide the tools for anyone to host a data mining competition • Makes it easy for competitors as well – they know where to go to find the data/competitions • Community/forum to find teammates
Kaggle Stats • Competitions started over 2 years ago • 55+ different competitions • Over 60,000 Competitors • 165,000+ Entries • Over $500,000 in prizes awarded
Why Use Kaggle? • Rich Diverse Set of Competitions • Real World Data • Competition = Motivation • Fame • Fortune
Methods used by competitors source:kaggle.com
Predict HIV Progression Prizes: Objective: Predict (yes/no) if there will be an improvement in a patient's HIV viral load. Training Data: 1,000 Patients Testing Data: 692 Patients
Training Training Set Test N/A N/A N/A N/A N/A N/A N/A N/A N/A N/A Public Leaderboard Private Leaderboard
Predict HIV Progression Features Provided: PR: 297 letters long – or N/A RT: 193 – 494 letters long CD4: Numeric VLt0: Numeric Features Used: PR1-PR97: Factor RT1-RT435: Factor CD4: Numeric VLt0: Numeric
Predict HIV Progression Concepts / Packages: • Caret • train • rfe • randomForest
Random Forest Tree 1: Take a random ~ 63.2% sample of rows from the data set For each node – take mtry random features – in this case 2 would be the default Tree 2: Take a different random ~ 63.2% sample of rows from the data set And so on…..
Caret – train TrainData <- iris[,1:4] TrainClasses<- iris[,5] knnFit1 <- train(TrainData, TrainClasses, method = "knn", preProcess= c("center", "scale"), tuneLength= 3, trControl= trainControl(method = "cv", number=10))
Caret – train > knnFit1 150 samples 4 predictors 3 classes: 'setosa', 'versicolor', 'virginica' Pre-processing: centered, scaled Resampling: Cross-Validation (10 fold) Summary of sample sizes: 135, 135, 135, 135, 135, 135, ... Resampling results across tuning parameters:
Caret – train k Accuracy Kappa Accuracy SD Kappa SD 5 0.94 0.91 0.0663 0.0994 7 0.967 0.95 0.0648 0.0972 9 0.953 0.93 0.0632 0.0949 11 0.953 0.93 0.0632 0.0949 13 0.967 0.95 0.0648 0.0972 15 0.967 0.95 0.0648 0.0972 17 0.973 0.96 0.0644 0.0966 19 0.96 0.94 0.0644 0.0966 21 0.96 0.94 0.0644 0.0966 23 0.947 0.92 0.0613 0.0919 Accuracy was used to select the optimal model using the largest value. The final value used for the model was k = 17.
Benefits of winning • Cold hard cash • Several newspaper articles • Quoted in Science magazine • Prestige • Easier to find people willing to team up • Asked to speak at STScI • Perverse pleasure in telling people the team that came in second worked at….
Chess Ratings Comp Prizes: Objective: Given 100 months of data predict game outcomes for months 101 – 105. Training Data Provided: Month White Player # Black Player # White Outcome – Win/Draw/Lose (1/0.5/0)
How do I convert the data into a flat 2D representation? Think: What are you trying to predict? What Features will you use?
Percentage of Games Won Number of Games won as White Number of Games Played Percentage of Games Won Number of Games won as White Number of Games Played White Games Played/Black Games Played Type of Game Played
Packages/Concepts Used: igraph 1st real function
Mapping Dark MatterMapping Dark Matter Prizes: The prize will be an expenses paid trip to the Jet Propulsion Laboratory (JPL) in Pasadena, California to attend the GREAT10 challenge workshop "Image Analysis for Cosmology". Objective: “Participants are provided with 100,000 galaxy and star pairs. A participant should provide an estimate for the ellipticity for each galaxy.”
dunnhumby's Shopper Challenge Prizes: • Objective: • Predict the next date that the customer will make a purchase • AND • Predict the amount of the purchase to within £10.00