Download
1 / 22
220 likes | 377 Vues
Exceptional Events Air Quality Management, Policy and Demonstration Tools Neil Frank USEPA/OAQPS/Air Quality Assessment Division AQS Conference August 21, 2008. New Exceptional Events Rule The Basics.

E N D
Exceptional Events Air Quality Management, Policy and Demonstration Tools Neil Frank USEPA/OAQPS/Air Quality Assessment Division AQS Conference August 21, 2008
New Exceptional Events RuleThe Basics • Sets criteria and process for EPA to agree to exclude event-influenced data when determining NAAQS compliance and design values. • Section 319 of the Clean Air Act, as amended by the SAFE-TEA-LU Act of 2005 required EPA to promulgate a rule to governthe review and handling of exceptional events data. • Final rule published March 22, 2007 (Effective date = May 21, 2007) • Scope: General rule which applies to all NAAQS. • CFR language defining NAAQS for ozone, PM2.5, and PM10 explicitly provides for exclusion of event-influenced data. • Preamble states EPA intention to effectively apply same scheme for other NAAQS also, via 107(d)(3) discretion. • EPA will formally extend the rule to other pollutants as NAAQS are revised, in time for new mandatory designations. • Replaces previous EPA policy/practices.
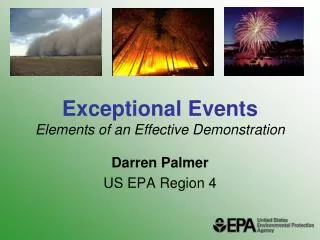
Definition of Exceptional Event“The Criteria” for potential data exclusion[§ 50.14] • Event affected air quality • Event was either • Natural or • Caused by human activity and unlikely to recur at a particular location • Event was not reasonably controllable or preventable • Event was not: • Air mass stagnation • Inversion • High temperature • Lack of precipitation • Source noncompliance • EPA Administrator has determined through the process established in the rule thatit was an exceptional event.
The Process to Justify Data ExclusionSection 50.14 of the EE Rule • Treatment of Air Quality Monitoring Data Influenced by Exceptional Events • A State may request that EPA exclude data related to exceedances or violations of a NAAQS that are directly due to an exceptional event from use in regulatory determinations • By demonstrating to EPA’s satisfaction that the event caused a specific air pollution concentration at a particular air quality monitoring location. • Demonstration to justify data exclusion • May include any reliable and accurate data • Must demonstrate a clear causal relationship between the measured exceedance or violation of the affected standard and the event.
The Process to Justify Data ExclusionSection 50.14 of the EE Rule • Provisions for data influenced by emissions from certain fireworks • Fireworks significantly integral to traditional national, ethnic, or other cultural events including, but not limited to July Fourth celebrations.
Notify the Public and EPA • Notify public of the occurrence (or anticipated occurrence) of the event • Notify EPA by Flagging the data. • Flag data in AQS and provide event description by July 1 of following year. • Also provide initial event description • Give public notice and opportunity to comment. • Types of Flags • Request data exclusion • Informational only
When May Air Quality Data be Excluded?“The Required EE Evidence” [§ 50.14 (3) ] • Demonstration to justify data exclusion shall provide evidence that: • The event satisfies the Statutory Definition of Exceptional Event • There is a clear causal relationship between the measurement under consideration and the event that is claimed to have affected the air quality in the area • The event is associated with a measured concentration in excess of normal historical fluctuations, including background; and • There would have been no exceedance or violation “but for” the event. • Provided that all the Exceptional Event Rule requirements are met, EPA shall exclude such data from use in determinations of a NAAQS violation. Note: The rule has special provisions regarding fireworks and prescribed fires. The preamble discusses other situations of interest.
Submittal of The EE Demonstration • Not later than the lesser of • 3 years following the end of the calendar quarter in which the event occurred • or 1 year before EPA plans to use the data for a regulatory decision. • A State must submit the public comments it received along with its demonstration to EPA. • In general, the type, amount, and detail level for presentation of evidence will vary by the circumstances for each event.
Types of Data to Considerfor EE evidence • Event characteristics: type, size, location, duration, estimated emissions, press accounts, response agency records, photos, videos, etc. • Comparisons to the concentration history at that monitor. • Comparisons to nearby monitors. • Diurnal patterns of concentrations, if available. • PM2.5 composition data, if available. • Satellite data products and related models. • Weather data. • Wind direction and speed. • Weather maps. • Trajectories (HYSPLIT or other). • Wind roses and pollution roses. • Statistical models relating air pollutant to weather.
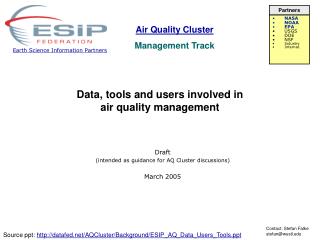
New On-Line Toolsto assist with assembly of evidenceProducts of Rudy Husar, Washington University • Graphics and access to relevant EE data sets • Trajectories, satellite images, spatial and temporal air quality displays, etc. • On-line tools are expected to remain operational as part of “DATAFED.NET” and ESIP (Federation Of Earth Science Information Partners) • In particular, see: • Evidence for Flagging Exceptional Events • http://wiki.esipfed.org/index.php/Evidence_for_Flagging_Exceptional_Events • Analyst's Console. • EE Community Work Space • http://wiki.esipfed.org/index.php/Exceptional_Air_Pollution_Event_Analysis_Community_Workspace
Catalog of Federated DatasetsAir Quality, Emissions, Meteorology
- THE ANALYST’S CONSOLE Analyst's Console.
Data Views Catalog: • CATT_FRMPM25_Traj • FRMPM25_diff • FRMPM25_30DayMedian • FRMPM25_Day • AIRNOW_PM25 • CATT_FRMPM25 • VIEWS SO4 • VIEWS_OCfCombined • MODIS_Aqua_RGB_OnEarthJPL • MODIS_Terra_RGB_OnEarthJPL • MODIS_AOT • OMI_AI • OMI_NO2Trop • MOPITT_CO • NAAPS_NoAm_AOT • NAAPS_NoAm_Sulf • NAAPS_NoAm_Dust • NAAPS_NoAm_Smok • NOAA_HMS_FirePix
Analyst Console http://www.datafed.net/consoles/user_consoles.asp?view_states=ARC/FRMPM25_Day_map,ARC/AIRNOW_PM25_map,ARC/NOAA_HMS_FirePix_map,ARC/OMI_AI_map,ARC/MODIS_AOT_map,ARC/MODIS_Terra_RGB_OnEarthJPL_map,ARC/MODIS_Aqua_RGB_OnEarthJPL_map,ARC/OMI_NO2Trop_map,ARC/CATT_FRMPM25_Traj_map,ARC/VIEWS_SO4_map,ARC/VIEWS_OCfCombined_map,ARC/NAAPS_NoAm_Sulf_map,ARC/NAAPS_NoAm_Smok_map,ARC/FRMPM25_30DayMedian_map,ARC/FRMPM25_diff_map&datetime=2007-05-24T18:00:00&Title=070524_GA_Smoke AirNow PM2.5 FRM PM2.5 May 24, 2007 Analyst's Console.
May 24, 2007 Analyst's Console.
Sulfate Carbon Naval Aerosol Analysis and Prediction System May 24, 2007 Analyst's Console.
To Describe Causal Connection (Transport)Source and Receptor Area Tools The user can move the rectangles http://webapps.datafed.net/datafed.aspx?page=0705GAFire/CATT_AQS_D http://webapps.datafed.net/datafed.aspx?page=0705GAFire/CATT_AQS_D_Rec
To Compare with Historical DataConcentration Anomaly Tool Historical 84th percentile for 30 day period Daily Increment http://wiki.esipfed.org/index.php/Help:Using_the_Concentration_Anomaly_Tool
The Analytical Challenge“but-for” evaluation • Only the red line is observable! • The blue line has to be inferred from other data: • Speciation • Continuous measurements • Models?
Have Fun! Be Safe! Don’t Create any Exceptional Events!