Download
1 / 37
370 likes | 601 Vues
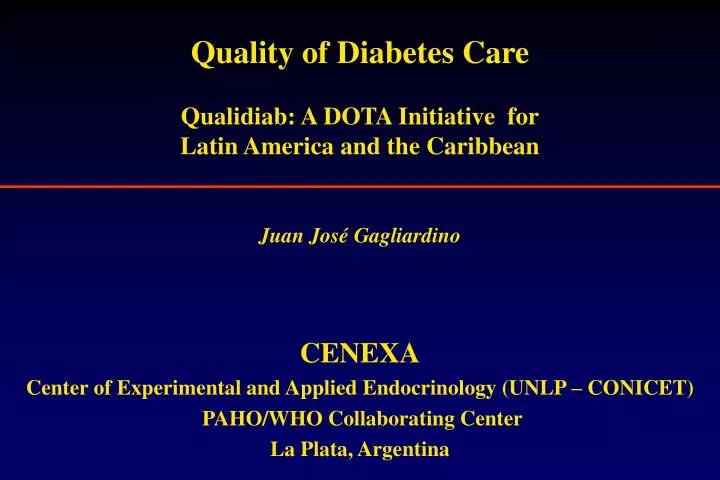
Quality of Diabetes Care Qualidiab: A DOTA Initiative for Latin America and the Caribbean . Juan José Gagliardino. CENEXA Center of Experimental and Applied Endocrinology (UNLP – CONICET) PAHO/WHO Collaborating Center La Plata, Argentina. 60 50 40 30 20 10 0. 1995. 2000. 2025.

E N D
Quality of Diabetes Care Qualidiab: A DOTA Initiative for Latin America and the Caribbean Juan José Gagliardino CENEXA Center of Experimental and Applied Endocrinology (UNLP – CONICET) PAHO/WHO Collaborating Center La Plata, Argentina
60 50 40 30 20 10 0 1995 2000 2025 EME FSE MEC India China OAI LAC SSA Estimates (1995, 2000) and Predictions (2025) of the Absolute Numbers of People with Diabetes No of people with diabetes (millions) EME = Established market economies FSE = Formerly socialist economies of Europe MEC = Middle Eastern Crescent OAI = Other Asia and islands LAC = Latin America and the Caribbean SSA = Sub-Saharan Africa Regional groupings according to World Bank (1993). Source: King H, et al (1998).
Developing countries Developed countries 50 40 30 20 10 0 120 100 80 60 40 20 0 20-44 45-64 64+ 20-44 45-64 64+ 1995 2025 The Number of People with Diabetes per Age Group (1995, 2025) Source: King H, et al (1998).
The Facts Rising burden Declining quality of life The Cause Rise in incidence and prevalence of diabetes and its complications The Reasons Demographic changes Socio-economic changes Industrialization & urbanization Unrecognized diabetes Unhealthy lifestyles The Challenge Implementation of prevention at all levels The Tools Appropriate control of diabetes and its risk factors Education of people with diabetes, the public and healthcare team members Continuous monitoring of impact Modification of interventions to increase their effectiveness Dr. Juan José Gagliardino member of the IDF Taskforce on Diabetes Health Economics
Knowledge and skills (health care team) Evaluation Patients empowerment (education) Accesibility (care, drugs and control devices) Q of C Prevention Adjustments Complications Better quality of life J.J. Gagliardino
Qualidiab Focus “Establish monitoring and control systems using state-of-the-art information technology for quality assurance in diabetes care.”
Qualidiab Instruments • Quality indicators • Basic information sheet • Computer programs • Local quality circles • LA and C Quality Network • Continous Quality development
Example New cases of blindness Proliferative retinopathy HbA1c, microalbuminuria Anxiety, well being Tests request frequency Feet and eye examination Blood pressure lowering therapy at increased albumin excretion Examples of the Qualidiab Indicators Type of indicator Outcomes • True outcomes • Intermediate outcomes • Quality of life • Treatment satisfaction Procedures • Documentation • Self-monitoring • Interventions
QUALIDIAB NET París Colombia (Caribbean Collecting Center) Brasil Paraguay Uruguay Argentina (South and Main Collecting Center) Chile
Characteristics of the Qualidiab Population Type 1 (%) Type 2 (%) Age 16-35 years 56-75 years Women DM duration (0-5 years) Known relatives with DM 37 (16-41) ---- 49 (36-64) 46 (26-71) 52 (21-80) ---- 56 (53-59) 61 (51-71) 49 (36-70) 43 (36-53) Number of cases: Type 1= 1229; type 2 = 12.284; total = 13.513
(18-66) (34-92) (33-100) (0-67) (17-71) (29-83) (38-83) (17-62) (49-72) (28-51) (17-81) (0-83) (7-76) (24-93) (79-94) (6-21) (49-90) (10-51) (95-100) (0-5) Detection of Complications and Cardiovascular Risk Factors In Type 1 DM µalbuminuria and prot. Triglycerides HDL-cholesterol Total cholesterol Creatinine HbA1c Retina Blood Pressure Foot care Body weight NO YES
(17-48) (51-93) (60-83) (0-42) (14-84) (16-86) (65-88) (10-35) (17-74) (26-93) (25-83) (0-89) (4-71) (29-96) (96-99) (2-4) (65-91) (10-35) (96-100) (0-4) Detection of Complications and Cardiovascular Risk Factors in Type 2 DM µalbuminuria and prot. Triglycerides HDL-cholesterol Total cholesterol Creatinine HbA1c Retina Blood Pressure Foot care Body weight NO YES
(50-84) (11-50) (3-31) (9-74) (22-66) (7-57) (5-26) (13-43) (0-61) (1-64) Glycemic and Cardiovascular Risk-factor Control In Type 1 DM <1.7 mmol/L >1.7 mmol/L >1.1 mmol/L <1.1 mmol/L <1.0 mmol/L >5.5 mmol/L <6.5 % >9.5 % <4.4 mmol/L >7.7 mmol/L Triglycerides HDL cholesterol Total cholesterol HbA1c Fasting glycemia 0 10 20 30 40 50 60 70
Glycemic and Cardiovascular Risk-factor Control in Type 2 DM (25-66) Triglycerides (34-68) (2-45) HDL- cholesterol (8-63) (25-40) Total cholesterol (37-77) (2-46) HbA1c (6-29) (6-42) Fasting glycemia (28-83)
Therapeutic Education in Type 1 DM Selfmonitoring Interpretation of s.m. Foot care Hypoglycemic control Member of an association (28-79) (21-72) (22-81) (19-78) (14-53) (51-84) (24-47) (53-76) (6-95) (5-94) No Yes
Therapeutic Education in Type 2 DM Selfmonitoring Interpretation of s.m. Foot care Hypoglycemic control Member of an association (61-99) (1-39) (54-96) (4-46) (11-52) (48-89) (35-70) (30-65) (6-99) (1-94) No Yes
Associated Cardiovascular Risk Factors in Type 1 DM <1.7 mmol/L >1.7 mmol/L >1.1 mmol/L <1.1 mmol/L <1.0 mmol/L >5.5mmol/L <140/90 >140/90 19-24 <19 (50-84) Triglycerides (11-50) (3-31) HDL cholesterol (9-74) (22-66) Total cholesterol (7-57) (46-83) Hypertension (7-47) (19-45) BMI (4-43)
Associated Cardiovascular Risk Factors in Type 2 DM <1.7 mmol/L >1.7 mmol/L >1.1 mmol/L <1.1 mmol/L <1.0 mmol/L >5.5 mmol/L <140/90 >140/90 19-24 >30 (25-66) Triglycerides (34-68) (2-45) HDL- cholesterol (8-63) (25-40) Total cholesterol (34-77) (35-44) Hypertension (52-64) (9-27) BMI BMI (19-54)
Hyperglycemia Treatment Type 2 Type 1 Only diet Only sulfonylureas Only metformin Associations Insulin : NPH Crystalline Combinations Spec. combinations Injections/day: 1 x 2 x 3 x > 3 x Pump Pen --- --- --- --- 22 (9-42) 0.3 (0-1) 50 (9-79) 4 (0-16) 5 (0-14) 43 (9-79) 16 (1-30) 9 (0-26) 0.1 (0-0.4) 12 (0-47) 13 (4-29) 33 (17-72) 9 (5-20) 14 (0-33) 14 (3-23) 0.4 (0-2) 7 (1-20) 1 (0-5) 5 (2-7) 12 (3-23) 1 (0-4) 1 (0-1.4) --- 2 (0-8) Values represent average % (range)
Type 1 Type 2 14 (10-22) [25] 5 (1-11) [49] 42 (20-48) [60] 16 (4-28) [66] Treatment of Cardiovascular Risk Factors Hypertension Hyperlipidemia (cholesterol + triglycerides) Values represent average % (range); [pathology frequency].
Retinopathy (prolif. - no prolif.) 10.0 20.0 38.0 48.0 Blindness 1.7 2.8 3.2 6.7 Peripheral neuropathy 21.0 37.0 42.0 29.0 ESRD 0.2 0.4 0.7 1.5 AMI (previous + last year) 1.5 1.8 4.3 6.7 CVA (previous + last year) 2.1 3.5 2.9 3.3 Amputations (previous + last year) 1.0 1.4 3.6 7.3 Frequency of Chronic Complications according to DM Duration Years COMPLICATION 0-5 6-10 11-20 >20 Figures represent average percentage values. Chi2 for trends p< 0.001; n= 13,513 persons
Knowledge and skills (health care team) Evaluation Patients empowerment (education) Accesibility (care, drugs and control devices) Q of C Prevention Adjustments Complications Better quality of life J.J. Gagliardino
EDUCATION Programmes and Contents Targets • Health promotion • Risk factors for CVD (risk groups) • Message to the diabetic population The community People with DM and their relatives • Continuous education programmes • Health-care organization according to the • levels of complexity • Minimal acceptable standards for • health-care and treatment The health-care team
There should be an education programme to explain to the community the importance of dieting and of striving to overcome sedentarism in order to avoid obesity and prevent the development of diabetes. Also to show the role of these interventions in the control and treatment of that disease. But this type of program should start among physicians. Elliot P. Joslin, 1925
The Worldwide Diabetes Epidemic: What can we do about it?
Strategies Retinopathy Nephropathy Neuropathy Cardiovascular & peripheral vascular disease Myocardial infarction All diabetes-related complications Microvascular disease Cardiovascular disease Heart failure Stroke All diabetes-related complications Diabetes-related deaths Total mortality Coronary heart disease (CHD) mortality Major CHD event Cerebrovascular disease events Type 1 Diabetes ↓27%-76%(1) ↓34%-57%(1) ↓60% Type 2 Diabetes ↓40%-65%(2) ↓70%(2) ↓54%(2) ↓16%(3) ↓12%(3) ↓37%(3) ↓51%(4) ↓56%(3) ↓44%(3) ↓24%(3) ↓32%(3) ↓43%(5) ↓34%(6)-36%(5) ↓33%(6)-55%(5) ↓62%(5) Improved blood glucose control Improved blood pressure control Improved lipid control Percentage Reduction of the Risk of Diabetic Complications Shown in Recent Studies Sources: (1) = DCCT (1993); (2) = Kumamoto Study (1995); (3) = UKPDS (1998); (4) = HOT (1998); (5) = ´4S´ Study (1997); (6) = Helsinki Heart Study (1987).
PROCAMEG Opinion leaders Guidelines Diabetologists from the chapters Teaching training GPs Regular courses
PROCAMEG Medical Education Knowledge • Procedures • Diagnostic • Control • Treatment • Attitudes • With patient • With other specialists DIABETOLOGY SOCIAL BEHAVIOUR
PROCAMEG Evaluation • Characteristics, previous training in DM and teaching experience of the participants • Degree of satisfaction (referred to the training course) • Program impact upon: knowledge (multiple choice) attitudes * results * *Follow up of a randomized patients sample
Previous attendance to other courses of diabetes Attendance to Diabetes/Endocrinology Services Prescription of a qualitative meal plan Interconsultation with specialists Glycemia required for oral hypoglycemic agents (OHA) prescription Frequency of OHA prescription Glycemia-HbA1c required for insulin prescription Diabetological knowledge Before the course (Correct answers) After the course 25 % 15 % 35 % 49 % 148 mg/dl Glibenclamide> metformin>both 230 mg/dl – 8.8 % 45 % 81 % Average Results verified in 25 PROCAMEG Courses (n=361)
Mexico Cuba Costa Rica Colombia Brazil Bolivia Paraguay Uruguay Argentina Chile Programa de Educación del Diabético No Insulinodependiente de Latinoamérica* PEDNID LA PEDNID LA *Non-Insulin-Dependent Diabetic Education Programme of Latin America
Sex (women vs men) (%) 64.1/35.9 - - - 54.6 ± 10.1 Age (years) Diabetes duration (years) 8.0 ± 13 BMI (kg/m2) 31.5 ± 0.3 (24/25) SBP (mmHg) 137.0 ± 1.0 (140) (90) DBP (mmHg) 84.9 ± 0.6 FBS (mg/dl) 184.0 ± 2.8 (<110) HbA1c (%) 8.9 ± 0.1 (<6.5) Cholesterol (mg/dl) 213.6 ± 2.0 (<200) TG (mg/dl) 184.8 ± 5.7 (<150) Main Characteristics of the Population Sample Variable Values Degree of Control* Data are means ± SEM (n=446). * Figures correspond to degree of “good” control.
FBG HbA1c * p<0.001 * p<0.001 n = 446 n = 323 * * -6mos 0 1 month 4 mos 8 mos 12 mos -6mos 0 1 month 4 mos 8 mos 12 mos Body weight SBP - DBP * p<0.001 ** p<0.05 n = 446 * ** * -6mos 0 1 month 4 mos 8 mos 12 mos -6mos 0 1 month 4 mos 8 mos 12 mos
Total Cholesterol Triglycerides * p<0.001 * p<0.001 n = 277 n = 237 * * -6mos 0 1 month 4 mos 8 mos 12 mos -6mos 0 1 month 4 mos 8 mos 12 mos
0 12 months Patients Tablets/year Cost/year (n) (n) (U$) Patients Tablets/year Cost/year (n) (n) (U$) Drug Oral hypoglycemic agent (Glibenclamide, 10 mg/d) Antihypertensive drug (Enalapril, 10 mg/d) Cholesterol lowering drug (Simvastatin, 20 mg /d) TOTAL 339 98 28 465 247470 71540 20440 339450 59640.27 21175.84 27123.88 107939.99 214 16 - 230 156220 11680 - 167900 37649.02 3457.20 - 41106.30 Annual Changes in Drug Intake and Cost Decrease in U$ 62 % Cost estimations were performed considering the mean daily intake of each drug as stated below and the average cost of these drugs in the Argentine market.
Recent Estimates of the Direct Cost (billion US$ and local currencies [LC]) to the Health-care Sector of Diabetes in Comparison with the Total Health-care Budget Estimated cost of DM (US$) Total health budget (US$) Estimated cost of DM (LC) Total health budget (LC) Country Denmark Finland France Germany Italy Japan Spain Sweden United Kingdom United States 0.54 0.46 7.30 10.67 4.50 16.94 2.04 0.88 4.65 60.00 9.12 7.84 121.66 179.36 74.95 282.42 33.93 14.72 76.94 1,007.00 3.8 2.6 45.2 19.7 8,220.0 2,070.0 320.0 7.5 2.9 60.0 64 44 753 331 137,000 34,500 5,330 125 48 1,007 Source: Adapted from Jönsson (1998). Note: The calculation of US$ sums is based on exchange rates as at 26 May 1999.