Download
1 / 9
90 likes | 167 Vues
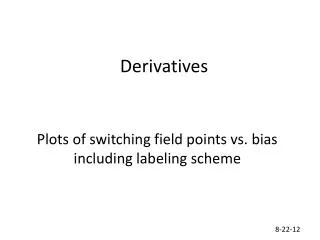
This study examines the switching field points in derivatives plots at various temperatures from 80K to 200K, comparing the bias effects. The analysis includes the labeling scheme for a comprehensive view of the data.

E N D
Derivatives Plots of switching field points vs. biasincluding labeling scheme 8-22-12
Cool #4 200K
Cool #4 150K
Cool #4 100K
Cool #4 80K