SFWMD
SFWMD. 7.3 million people (2005) (45 % of FL) 17 k sq mi (31 % of FL) 16 counties (Dade; Broward) Lake Okeechobee, Everglades Four canals (West Palm Beach, Hillsboro, North New River and Miami) water supply to LEC, flood releases, excess runoff from (EAA).

SFWMD
E N D
Presentation Transcript
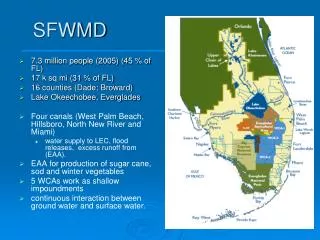
SFWMD • 7.3 million people (2005) (45 % of FL) • 17 k sq mi (31 % of FL) • 16 counties (Dade; Broward) • Lake Okeechobee, Everglades • Four canals (West Palm Beach, Hillsboro, North New River and Miami) • water supply to LEC, flood releases, excess runoff from (EAA). • EAA for production of sugar cane, sod and winter vegetables • 5 WCAs work as shallow impoundments • continuous interaction between ground water and surface water.
2.2% 9.5% 5.8% 82.5% 7.2% 27.5% 5.3% 60.0% 13.3% 27.8% 6.4% 52.5% Change in Land Use SFWMD 1953 1973 1995
Water Demand Consumptive and non-consumptive use
Average Rainfall 1915-1995 53 in - 73 % in May to October 70 % ET El Niño
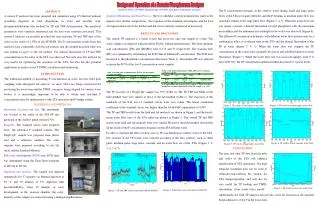
Deviation from Mean Annual Rainfall 1 in 10 year: dry (44.3 in) and wet (62.5 in)
Historical Extent of Saltwater Intrusion in Coastal Miami-Dade County 8 miles Tampa-St Petersburg metro area
Water Reuse by Planning Region Overall SFWMD 27 % State 38 %
Challenges of WR planning in SF SF classic example of human vs. ecosystem conflict over water • Population growth and urban expansion • Increasing water demand • Dependence on ground water for potable supply • Salt water intrusion • Environmental flow to Everglades (restoration $10 B in 30 years) • Minimum Levels and flows for Lake Okeechobee and Biscayne aquifer • Vulnerability to contamination (Water Quality) • Flood Control • Conflicts among and within regions for water allocation (Riparian vs appropriation) • Climate Variability (annual and seasonally variable rain and drought cycles) • Climate Change (sea level rise, change in temp. and ppt).
Research Questions • What are some major changes in terms of population growth, land use, water demand, and water availability that can be expected in the short and long term? • What would be the major effects of climate variability and change on water system (demand and availability)? • What are most promising policies (based on multiple criteria) for water management in response to growth and climate change?
Climate Variability and Change Population births, deaths, net migration, tourists Land use natural, urban, agriculture, water Economy GDP, tourism, jobs Water surface and ground Availability net rainfall, inflows, desalination, transfer Demand Urban, agriculture, environmental Environment Pollution Conceptual model for Integrated WR Planning