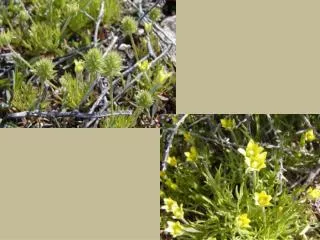
Buttercup Study
Buttercup Study. Buttercup Study. Treatment Breakdown Data Collection. Results and Implications. Buttercup Study. Treatment Breakdown Data Collection. Results and Implications. Plot Layout. Rep I. Rep II. 101. 102. 103. 201. 202. 203. 104. 105. 106. 204. 205. 206. Rep III.


Buttercup Study
E N D
Presentation Transcript
Buttercup Study • Treatment Breakdown • Data Collection • Results and Implications
Buttercup Study • Treatment Breakdown • Data Collection • Results and Implications
Plot Layout Rep I Rep II 101 102 103 201 202 203 104 105 106 204 205 206 Rep III Rep IV 401 402 403 301 302 303 404 405 406 304 305 306
Plot Layout Rep I Rep II 101 102 103 201 202 203 40 ft 40 ft 104 40 ft 105 106 204 205 206 Rep III Rep IV 401 402 403 301 302 303 404 405 406 304 305 306
Aeration Treatment Rep I Rep II Aeration No Aeration 101 102 103 201 202 203 No Aeration Aeration 104 105 106 204 205 206 Rep III Rep IV No Aeration Aeration 401 402 403 301 302 303 Aeration No Aeration 404 405 406 304 305 306
Fertilization Treatment Rep I Rep II Fertilizer No Addition Fertilizer + Lime Fertilizer Fertilizer + Lime No Addition 101 102 103 201 202 203 104 105 106 204 205 206 Rep III Rep IV Fertilizer + Lime No Addition Fertilizer No Addition Fertilizer + Lime Fertilizer 401 402 403 301 302 303 404 405 406 304 305 306
Aerway Aeration -Twice in 2002 -Once in 2003
Fertilization • Spring 2002: ~ 3800 lbs/ac lime applied • Spring 2003: ~ 4480 lbs/ac lime applied • 2004: no lime applied • pH approaching 6.5 goal (up from ~5.7)
Buttercup Study • Treatment Breakdown • Data Collection • Results and Implications
40 readings / transect 4 transects / plot 24 plots Transects Transects Sample Plot
Buttercup Study • Treatment Breakdown • Data Collection • Results and Implications
Summary of Results • Soil tests: • Liming increased Ca levels and pH • Forage Samples: • Legume percentage increased with liming • Buttercup percentage decreased with aeration • Transect data: insignificant • Cow counting data: insignificant
Buttercup Study • Treatment Breakdown • Data Collection • Results and Implications