Download
1 / 25
250 likes | 369 Vues
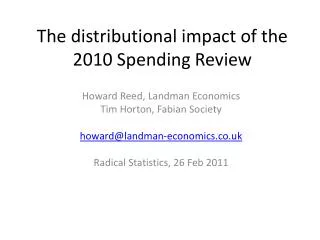
The distributional impact of the 2010 Spending Review. Howard Reed, Landman Economics Tim Horton, Fabian Society howard@landman-economics.co.uk Radical Statistics, 26 Feb 2011. Outline. Working out the distributional effects of spending changes Allocating spending (and cuts) to households

E N D
The distributional impact of the 2010 Spending Review Howard Reed, Landman Economics Tim Horton, Fabian Society howard@landman-economics.co.uk Radical Statistics, 26 Feb 2011
Outline • Working out the distributional effects of spending changes • Allocating spending (and cuts) to households • How much of each service is being cut? • Impacts by: • Point in the income distribution • Family type • Combining tax/benefit measures and spending measures
Modelling the distributional effects of public spending • Tim Horton and Howard Reed Where the Money Goes: How we benefit from public services http://www.tuc.org.uk/extras/wherethemoneygoes.pdf • We use household data on service use to model the effects of spending on several areas, most importantly: • Health (General Household Survey) • Education (Family Resources Survey) • Social Care (British Household Panel Survey) • Social Housing (Family Resources Survey) • Transport (Expenditure and Food Survey) • FRS used as the main dataset with other info added via predictions from regressions of service use on income and demographic characteristics
Modelling the distributional effects of public spending • Where we have no data to assign services to households or where it doesn’t make sense conceptually (e.g. defence, environmental protection etc.) we allocate services on a flat-rate cash basis according to household size • The model only includes ‘services-in-kind’ – not transfer payments such as benefits or tax credits (which other studies have looked at, e.g. IFS) • We include current and capital spending (assuming capital spending has similar distributional impacts to current) • Thus the model allocates all spending on services to households (Treasury’s analysis in CSR appendix B only allocated around 50% of spending at best) • Obviously requires more assumptions – but gives a fuller picture
Average public spending by household income: percentage of net income
How big are the cuts? Total spending cuts by 2014-15: £81bn - Reduced debt interest -£10bn - Reduced benefits/tax credits -£18bn = Nominal spending cuts £53bn At 2010-11 prices: £48bn
Which services are being cut? • Spending review gives departmental spending totals • Horton/Reed model analyses spending by function • A detailed mapping is available between the two – but only ex post • ex ante we have to make assumptions:
Spending cuts by service – easier cases Overall cuts by 2014-15 in real terms: Health 0% Education (schools) -10% Transport -15%
Spending cuts by service – our assumptions in harder cases Mainly these are where large portions of expenditure are devolved to local authorities: Social care -20% Social housing -24% Or where funding is only part of a departmental settlement: Policing -20% HE/FE, adult education -27%
Spending cuts by service – other assumptions Other income related categories – average reduction of 18% Flat rate categories – average reduction of 18% except defence (8%) Overall spending reduction (as a proportion of all public spending on services-in-kind): 12%
Effects of spending cuts by income group: cash terms, allocating services related to household use only
Effects of spending cuts by income group: cash terms, all services
Effects of spending cuts by income group: as % of net income, all services
Effects of spending cuts by income group: as % of net income plus value of services, all services
Effects of spending cuts by family type: cash terms, all services
Effects of spending cuts by family type: as % of net income, all services
Effects of spending cuts by family type: as % of net income plus service value, all services
What about the tax and welfare measures? • Using figures from the Institute for Fiscal Studies’s post-CSR briefing to show the impact of the tax, benefit and tax credit changes: • Note that IFS attempted to model all benefit and tax credit measures (except the “universal credit”) whereas HMT (in CSR appendix B) modelled only a subset.
Distributional impact of tax, benefit and tax credit measures – cash terms Source: IFS post-CSR briefing, 21 October
Distributional impact of tax, benefit and tax credit measures – as % of net income Source: IFS post-CSR briefing, 21 October
Distributional impact of tax/benefit and spending measures – as % of net income Source: spending – Landman Economics, tax/benefit – IFS
Distributional impact of tax/benefit and spending measures – as % of net income and value of services received Source: spending – Landman Economics, tax/benefit - IFS
Conclusions • Impact of CSR on household living standards appears to be very regressive under reasonable assumptions about how the benefits of public spending are distributed • Poorest are hit 15 times harder than the richest if you measure changes as a proportion of income • Poorest are hit 5 times harder than the richest if you measure changes as a proportion of income plus the value of public spending received • Families with children and single pensioners hit hardest in percentage terms (due to education and social care cuts respectively )
Winning the argument? • Immediately after June 2010 Budget 45% of YouGov respondents thought cuts were being done fairly • By February 2011 this had shifted to 62% thinking the cuts were unfair (net -22) • 50% of voters also thought cuts were too deep by Feb 2011 • 51% also think cuts are bad for the economy (only 34% think they are good) • However, 55% think cuts are necessary (33% think they are unnecessary) • 49% blame Coalition for the cuts, 65% blame Labour (24% blame both)