Download
1 / 27
270 likes | 366 Vues
This study examines emission-line galaxies over the past ten billion years, focusing on star-forming galaxies, dust attenuation, gas metallicities, and morphology. It discusses various projects related to star formation, galaxy evolution, and observational techniques. The narrow-band technique, used to identify star-forming galaxies, is explored along with its advantages over other methods. The study also delves into the significance of star formation history, baryonic structure evolution, and testing theoretical models. The Subaru Deep Field narrow-band survey, its methodology, and findings are detailed, highlighting the unique insights gained from this deep and broad-range study.

E N D
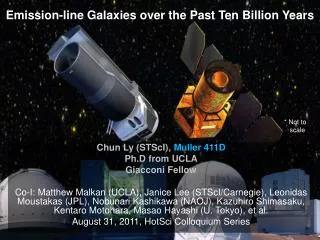
Emission-line Galaxies over the Past Ten Billion Years * Not to scale Chun Ly (STScI), Muller 411D Ph.D from UCLA Giacconi Fellow Co-I: Matthew Malkan (UCLA), Janice Lee (STScI/Carnegie), Leonidas Moustakas (JPL), Nobunari Kashikawa (NAOJ), Kazuhiro Shimasaku, Kentaro Motohara, Masao Hayashi (U. Tokyo), et al. August 31, 2011, HotSci Colloquium Series
Outline • Motivation • Narrow-band Surveys with Subaru, NOAO/CTIO, and Magellan Observatories • Characterizing Star-forming Galaxies • Dust attenuation • Morphology and merger rates for field star-forming galaxies • Gas metallicities and extremely metal-poor galaxies • Summary and Remarks on Future Prospects Other Projects • Census of Star Formation at the Epoch of Peak Star Formation (see Ly et al. 2011) • Star Formation and Clustering of >1011 Msun Galaxies in the NDWFS/Boötes Field • Galaxy morphology in field vs. (proto-)cluster environment at z~1.6 • High Resolution VLBA Imaging of the Jet Collimation Region in M87 (Ly et al. 2004; Ly et al. 2007) • Multi-wavelength coordinated observations of GeV and TeV flares associated with the massive black hole in M87 (Acciari et al. 2009) 2
Star Formation: Connected with Different Views of Galaxy Evolution Baryonic structure evol. STAR FORMATION (HISTORY) SN and metal enrichment The Hubble sequence Two techniques I use to identify star-forming galaxies at z<3: Narrow-band imaging High-z two-color selection (so called LBGs, BX/BMs, BzKs) SFRs derived from Ha, other nebular emission lines, and UV continuum Tarantula Nebula in the LMC (Credit: Hubble) 3
Still in the Realm of Testing Theories Lilly-Madau Plot • Although SFR density measurements and luminosity functions have been around for ~15 years, SFR density measurements show differences of a factor of ~2-3 at any given redshift. • This inhibits a fair understanding of how star formation occurred when compared against theoretical predictions. Models are from Nagamine et al. (2006) and Choi & Nagamine (2009) 4
The Narrow-band Technique • Capable of tuning towards nebular emission lines prominent in star-forming galaxies and AGN • Typically ~100A FWHM => z/(1+z) of ~1% or better • More accurate than typical photometric redshifts and faster than spectroscopy for obtaining emission-line fluxes • Selection is often based on EW, not mass or SFRs • I will discuss the advantage of selecting by EWs later • Strongest lines are Ly, H, H, [O III] 5007, [O II] 3727 • Many surveys: Fujita et al. (2003), Nakajima et al. (2008), Morioka et al. (2008), Dale et al. (2008), Shioya et al. (2008), Westra et al. (2008), Takahashi et al. (2007), etc. H H [O III] 5 [O II] SDSS composite of Sm/Im galaxies (Yip et al. 2004)
Identifying Narrow-band Excess Emitters Z' - NB921 EW(obs) ~ 30A NB921 Comparison against broad-band imaging to identify excess flux Select objects with a minimum BB-NB excess (blue line) and red line for 3deviation from featureless objects 1,000-2,000 NB emitters per filter of >100,000 galaxies in the Subaru Deep Field (0.25 deg2) Complete in EW until ~24 mag AB 6
The Subaru Deep Field (SDF) 27’ 34’ HDF SDF = 160 HDF's SDF = 5.7 GOODS-N's Imaging from 1500A (GALEX/FUV) to K-band (UKIRT) to Spitzer/IRAC to Spitzer/24m to VLA/21cm 28 bands! Photo-z's from 20 bands Accuracy of 1.2% in dz/1+z for z<1.6 Cycle 16 #11149 (PI: E. Egami) NICMOS and WFC3/IR observations + Spitzer/IRAC of z>6 galaxies Combination of area coverage, depth, and pan-chromatic coverage makes the SDF unique Kashikawa et al. (2004) Deeper by avoiding OH sky lines GOODS-N FoV of Suprime-Cam 7
The SDF Narrow-band Survey • Published in Ly et al. (2007), ApJ, 657, 738 and • forthcoming papers (Ly et al. 2011) • A survey with five optical narrow-bands with Subaru/Suprime-Cam in the SDF. The deepest of all narrow-band surveys, and with five filters, covering the largest volume (a total of several X 105 Mpc3) that span a wide redshift range • Filter centers: 7046A, 7111A, 8150A, 9196A, and 9755A with FWHM of 100A, 73A, 120A, 132A, and 200A, sampling 15 windows between z=0.07 (with H) and z=1.6 (with [O II]) 8
The SDF Narrow-band Survey NB704 NB816 NB711 NB921 • Published in Ly et al. (2007), ApJ, 657, 738 and • forthcoming papers (Ly et al. 2011) • A survey with five optical narrow-bands with Subaru/Suprime-Cam in the SDF. The deepest of all narrow-band surveys, and with five filters, covering the largest volume (a total of several X 105 Mpc3) that span a wide redshift range • Filter centers: 7046A, 7111A, 8150A, 9196A, and 9755A with FWHM of 100A, 73A, 120A, 132A, and 200A, sampling 15 windows between z=0.07 (with H) and z=1.6 (with [O II]) Deeper by avoiding OH sky lines 9
The SDF Narrow-band Survey • Published in Ly et al. (2007), ApJ, 657, 738 and • forthcoming papers (Ly et al. 2011) • A survey with five optical narrow-bands with Subaru/Suprime-Cam in the SDF. The deepest of all narrow-band surveys, and with five filters, covering the largest volume (a total of several X 105 Mpc3) that span a wide redshift range • Filter centers: 7046A, 7111A, 8150A, 9196A, and 9755A with FWHM of 100A, 73A, 120A, 132A, and 200A, sampling 15 windows between z=0.07 (with H) and z=1.6 (with [O II]) • A total of ~8700 narrow-band excess emitters is identified over 0.25 deg2 • Survey depth: 0.001-0.09 L*(z) 10
Narrow-band Technique Provides a More Unbiased Census BX/BM technique misses reddest galaxies (23%) 35% BX/BM and BzK 625 [O II] emitters at z=1.47 sBzK BX/BM BzK technique misses bluest emission-line galaxies (27%) This comparison is difficult to perform to the level of accuracy with spectra ~15% of [O II] emitters not accounted by color selection 11 RC – z' (2700A - 3700A)
Kennicutt et al. (1998) L(Ha) -> SFR No evolution in dust with L(H) over the past five billion years SED modeling with 15 bands, assumed an exponential SFH (a.k.a. t model) Outstanding: Balmer decrement from optical spectroscopy Ly et al. (2011), in prep. Hopkins et al. (2001) reddening law for z~0 works fairly well over 3 dex at z~0.5. No z evolution An assumed Calzetti et al. (2000) reddening law with E(B-V)stellar = E(B-V)gas / 0.54 works! 12
A Wide-Field, Large-Volume Search for Extremely Metal-Poor Galaxies (EMPGs) or z' emitters Studies have found that high-EW (>200A) emission-line galaxies are often young low-mass galaxies undergoing intense star formation and potentially are of extremely low metallicities (Hu et al.). But with the limited range in dz, the samples from using the NB excess technique have been small. An analogous approach that is sensitive to high-EW emission lines, is to search for depression in the NB due to strong emission lines in the broad-bands. Many similar techniques have been employed (e.g., Nagao et al. 2006; van der Wel et al. 2011). Method has been confirm with spectroscopy. This survey aims to search for EMPGs over a broader range in redshift (dz ~ 0.5) and over 2 deg2 (COSMOS and SDF). Using bands of different widths, photo-z's, SED modeling, and spec-z's, we can characterize the population to identify candidates that would be of low gas metallicity for follow-up spectroscopy. Photo-z failures -> Interesting for testing photo-z codes. 13
Detection of [O III] l4363 with the 6.5m MMT! Metal poor, but not extreme Extremely metal-poor case Weak [O II] Hectospec. Net integration: ~2 hours; Seeing: ~ 0.8”-1.0” Plans: Leverage both MMT/Hectospec (wide-area search for metal-poor galaxy candidates) and Keck/DEIMOS or LRIS (deep observations for improved sensitivity of weak emission lines) 14
Iva Momcheva (Carnegie) Masami Ouchi (U. Tokyo) Danny Dale (U Wyoming) PI: Janice Lee Seeking graduate students for this project. Interested? Let's chat afterwards Samir Salim (Indiana) Rose Finn (Siena) Chun Ly Extending Deep Wide H Galaxy Surveys to Higher Redshift with NEWFIRM and FourStar See recent papers: Ly et al. (2011), ApJ, 726, 109; Nakajima et al. (2011), arXiv:1105.2824 Ha is one of the most reliable SFR indicators. An established history of Ha studies at z<0.5 (Kennicutt et al. 1983; Ly et al. 2007) has provided much of the basis of our current understanding of star formation. Deep Ha galaxy surveys at higher redshift are needed, but requires near-IR imaging. NewH Survey Team 15 15
NEWFIRM (wide-shallow) and FourStar (deep-narrow) NEWFIRM (PI: R. Probst) Probst et al. (2008), SPIE FourStar (PI: E. Persson) Persson et al. (2008), SPIE NEWFIRM (commissioned late 2007), mounted on either the Mayall or Blanco telescope, is a 28' x 28' imager with four 2k2 InSb detectors. Wide but shallow component of the survey. Typical seeing is 1”. FourStar (commissioned Feb 2011), mounted on the Magellan Baade telescope, is a 10.8' x 10.8' imager with four 2K2 HAWAII-2RG detectors. Allows for a factor of few in improved sensitivity with sub-arcsec seeing (typically 0.5”). 16 16
NewH Narrow-Band Filters NB118 NB209 Purchased four filters. Installed, tested, and calibrated on NEWFIRM and FourStar (two filters each). Five NEWFIRM pointings ~ 1 deg2. Two or three pointings with FourStar. Survey expected to be completed later this year. First paper on the Ha LF is published, gas metallicity, Lya emitters, dust reddening (Momcheva et al. 2011, in prep), and rest-frame optical morphology! Observed NEWFIRM H SFR depths: 1 Msun yr-1 @ z=0.81; 8 Msun yr-1 @ z=2.2 Other IR narrow-band surveys (e.g., HIZELs) are not using custom filters. Suffer from higher background -> lower sensitivity. Lee & Ly et al. 2011, in prep 17
Subaru-XMM Deep Survey (SXDS) a.k.a. the UKIDSS Ultra Deep Survey (UDS) Cyan – NB118 excess emitters 2MASS J-band 1 degree More NEWFIRM NB209 Imaging this Fall, overlapping with CANDELS/UDS!
Follow-up Spectroscopy, Filter Coupling Magellan-IMACS multi-object optical spectroscopy for half of our NB118 excess emitters. FoV is well matched: 0.5 deg. Great for z < 1.5 galaxies. Distinguish [S II] from Ha. For z ~ 2.2, the NB118 and NB209 filters are coupled such that we get [O II] and Ha simultaneously. NewHa emitters are excellent targets for follow-up NIR spectroscopy. Also, we have Subaru/Suprime-Cam NB filter observations centered at ~3900A to obtain Lya at z ~ 2.2 (PI: M. Ouchi). The coupling of the filters will allow us to determine if [O II] is reliable SFR indicator and examine the Lya escape fraction (Nakajima et al. 2011, ApJ, submitted, arXiv:1105.2824). 19
CANDELS COSMOS WFC3 data in Feb '12! ACS WFC3 The whole CANDELS COSMOS pointing is covered with NEWFIRM (Feb. '11) More FourStar observing this Fall in SXDS, overlapping with CANDELS/UDS! NB209 emitters (N=159) z=2.2 Ha Dual emitters (N=43) 20
The H LF at z ~ 0.8 For details, see: Ly et al. (2011), ApJ, 726, 109 Variance consistent with LCDM models There is a debate over the faint-end slope due to completeness corrections. FourStar will resolve this. 21
Steep Faint-end: The z~ 2.2 Ha LF More FourStar and NEWFIRM observing this Fall! Compared to UV faint end: –1.74 (Reddy et al. 2008) NEWFIRM pointings to be included for shallow end 22 Lee et al. (2011), in prep.
Evolution of the H SFR Density Assumed 11% AGN contamination Fit based on Dale et al. (2010) without NewHa measurements Subaru + Wyoming Published SDF H values H LFs are fitted with a Schechter function Integral -> H luminosity density This is converted to a SFR density using the Kennicutt (1998) relation: SFR(Msun yr-1) = 7.9X10-42 LH(erg s-1) We find strong evolution, (1+z)3.4, in the SFR density determined from H a = -1.75 assumed 23 23
Ha Surveys Point to L* Evolution with Cosmic Time L* z 24 24
Morphologies and Merger Rates for z~0.8 Ha Selected Galaxies 57 kpc Public CANDELS/UDS F125W Imaging In collaboration with J. Lotz and A. Koekemoer GALAPAGOS – for Sersic fitting with GALFIT -> nSersic ~ 0.5 Merger signatures: Gini-M20 (Lotz et al. 2006), CAS (Conselice et al. 2003) Frequency of pairs Will compare with z~0.24 COSMOS sample with ACS-F814W imaging to examine redshift evolution CANDELS data for z~2.2 will extend it to higher redshifts 25 25
Summary and Future Work • Emission-line surveys are efficient tools for studying galaxy evolution • The narrow-band method provides a more unbiased census of star-formation when compared to high-z color selection techniques (BX/BM, BzK); Good news for future spectroscopic studies • No redshift evolution in the dust properties of star-forming galaxies with L(Ha) • Calzetti's reddening law gives reasonable estimate of dust attenuation over three orders of magnitude in SFRs from modeling SED for E(B-V) • Wide area surveys will uncover extremely metal-poor galaxies • MMT is able to compete with 10-m class telescopes in finding EMPGs • Faint-end slope of the Ha luminosity is steep: a ~ -1.75. Dwarf galaxies are important for the bulk of star formation at z~2 • Evolution in Ha SFR density is due mostly to L* evolution: (1+z)3.4 • About ½ of z~0.8 Ha selected galaxies appear to have close companions • Will look for redshift evolution of frequency of mergers and pairs to z~2.2 Find me in Muller 411D 26 26
THE END 27