Download

1 / 44
440 likes | 560 Vues
Learn about population dynamics, recruitment, and vital rates in fish populations. Understand the importance of studying ecosystem processes. Dive into mark-recapture methods for fisheries management.

E N D
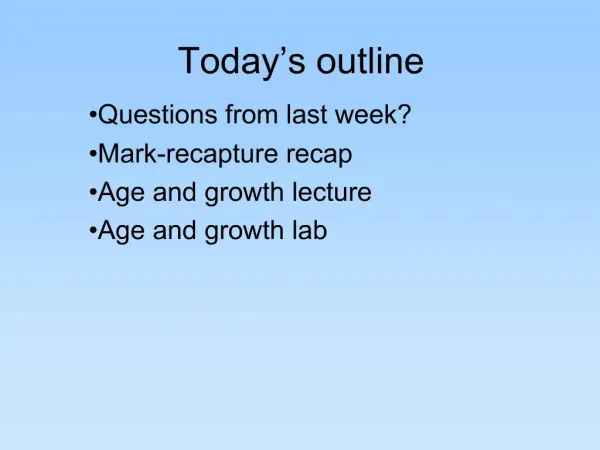
Today’s outline • Reading quiz • Reading discussion • Field trip briefing/electrofishing safety • Population dynamics lecture • Break • Mark-recapture lab
What limnological relationship was the motivation for this study? (Hint: NOT trophic cascades) (1pt) • If the population of piscivores increases in a lake, what happens to the density of phytoplankton? (2pts) • There is a time lag in trophic cascades: why? (2pt)
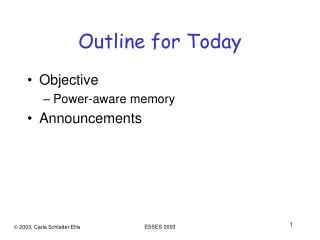
Lake Productivity Nutrients (mg P/L)
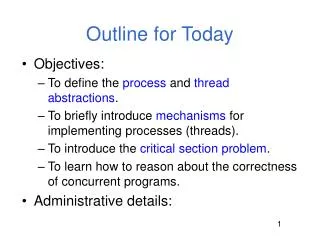
Invertebrate Planktivore Vertebrate Planktivore Large zooplankton Nutrients (P and N)
How do you interpret this figure? What piece of information does it convey?
Population dynamics Zoo 511 Ecology of Fishes
Today’s goals • Understand why and how population dynamics are important in fisheries ecology • Gain experience in a variety of mark-recapture methods
“A population is a group of fish of the same species that are alive in a defined area at a given time” (Wootton 1990)Population dynamics: changes in the number of individuals in a population or the vital rates of a population over time What are population dynamics?
Why study population dynamics? • Often most relevant response to ecosystem manipulation/perturbation • Endangered species (population viability analysis, PVA) • Fisheries management (sustainable yield) • Understand ecosystem dynamics and ecological processes
Why study population dynamics? Atlantic salmon PVA From Legault 2004 • Often most relevant response to ecosystem manipulation/perturbation • Endangered species (population viability analysis, PVA) • Fisheries management (sustainable yield) • Understand ecosystem dynamics and ecological processes PVA: Modeling the probability that a population will go extinct or drop below the minimum viable population size within a given number of years.
Why study population dynamics? • Often most relevant response to ecosystem manipulation/perturbation • Endangered species (population viability analysis, PVA) • Fisheries management (sustainable yield) • Understand ecosystem dynamics and ecological processes from Hilborn and Walters 1992
Why study population dynamics? • Often most relevant response to ecosystem manipulation/perturbation • Endangered species (population viability analysis, PVA) • Fisheries management (sustainable yield) • Understand ecosystem dynamics and ecological processes When do ecological shifts occur? Are they stable?
How do populations change? • Nt+1 = Nt + B – D + I – E • B = births • D = deaths • I = immigration • E = emigration Immigration Stocking Population Births Deaths Angling Emigration
Density Dependence Rate of Change (per capita) Population Density
Rate of population increase Density independent per capita annual increase Density dependent N
Small group exercise Population starts at low density. What happens to density over time under density-dependent rate of increase? What happens if rate of increase is density-independent? Density-dependent Density-independent Population density Population density ? ? Time Time
Small group exercise Population starts at low density. What happens to density over time under density-dependent rate of increase? What happens if rate of increase is density-independent? Density-dependent Density-independent Population density Population density Logistic Exponential Time Time
Logistic population growth dN/dt=r0N(1-N/K) r0 = maximum rate of increase K= carrying capacity r0 per capita annual increase N K
How do populations change? • Nt+1 = Nt + B – D + I – E • B = births • D = deaths • I = immigration • E = emigration Immigration Stocking Population Births Deaths Angling Emigration
Survival • Predation • Disease • Prey availability • Competition for food • Harvest “Natural Mortality” S
Survival • Eggs and larvae suffer the largest losses Recruit! HATCH 2 cohorts each produce 10,000,000 eggs 90.5% survivorship/day yields 24,787 survivors at 60 days 95.1% survivorship/day yields 497,871 survivors at 60 days
Recruitment • Can mean many things! • Number of young-of-year (YOY) fish entering population in a year • Number of fish achieving age/size at which they are vulnerable to fishing gear • Somewhat arbitrary, varies among populations • Major goal of fish population dynamics: understanding the relationship between stock size and recruitment
What determines recruitment? -Stock size (number and size of females)
Density-independent Ricker What determines recruitment? Recruitment Beverton-Holt From: Wootton (1998). Ecology of teleost fishes. spawning stock biomass (SSB)
From: Cushing (1996). Towards a science of recruitment in fish populations
Highly variable recruitment results in naturally very variable catches From: Jennings, Kaiser and Reynolds (2001). Marine Fisheries Ecology
Population Abundance • On rare occasions, abundance can be measured directly • Small enclosed systems • Migration
Catch per unit effort (CPUE) • Very coarse and very common index of abundance 1 Catch= 4 fish CPUE=4/48=0.083 Effort= 4 nets for 12 hours each= 48 net hours 2 Catch=8 fish CPUE=8/48=0.167 Effort= 4 nets for 12 hours each= 48 net hours We conclude population 2 is 2X larger than population 1
Population abundance • Density estimates (#/area) • Eggs estimated with quadrats • Pelagic larvae sampled with modified plankton nets • Juvenile and adult fish with nets, traps, hook and line, or electrofishing • Density is then used as index of abundance, or multiplied by habitat area to get abundance estimate
Depletion methods Closed population Vulnerability constant for each pass Collection efficiency constant Often not simple linear regression * * N * * Time (or pass)
Mark recapture M=5 C=4 R=2 N=population size=????
Modified Petersen method • Assumptions: • Closed population • Equal catchability in first sample • Marking does NOT influence catchability • Marked and unmarked fish mix randomly • Mortality rates are equal • Marks are not lost
How to avoid violation of assumptions? • Two sampling gears • Distribute marked individuals widely; allow time for mixing • Can be separated into different groups • Length • Sex • Geographic regions
How many to mark/recapture? • Requires some knowledge of population size! • Trade-off between precision and sample size • Population of 10,000: Mark 400 and examine 600 for +/- 50% OR mark 1,000 and examine 1,500 for +/- 10% • Trade-off between marked and recapture sample size • Population of 10,000: Mark 1,000 and examine1,500 OR Mark 4,500 and examine 500
Schnabel method • Closed population • Equal catchabilty in first sample • Marking does NOT influence catchability • Multiple recaptures • Easier to pick up on violation of assumptions
Jolly Seber method • Open populations • Allows estimation of births and deaths • Three or more sampling periods needed • Equal catchability of all individuals in all samples • Equal probability of survival • Marks are not lost • Sampling time is negligible compared to intervals between samples
Importance of uncertainty • Confidence intervals • Long-term frequency, not probablity! • 95% confidence intervals if you repeated procedure an infinite number of times, 95% of the time the interval you create would contain the “true” value • Precision vs. accuracy x x x x x x x x x x x x x x x x x x Accurate, not precise Not accurate, precise Accurate, precise