Raw Scores
190 likes | 422 Vues
Raw Scores. Un-Grouped Frequency Distribution. Grouped Frequency Distribution. Percentile and Percentile Rank. Percentile ( P X ) or Percentile Point The value on the measurement scale (at or) below which a specified percentage of the scores in the distribution fall.

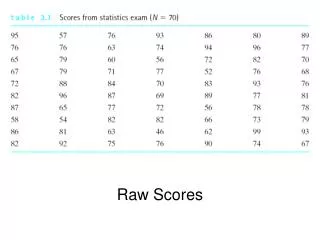
Raw Scores
E N D
Presentation Transcript
Percentile and Percentile Rank • Percentile (PX) or Percentile Point • The value on the measurement scale (at or) below which a specified percentage of the scores in the distribution fall. • Where x from Px is a percentage • Looking for a score (value) • Percentile Rank (PRX) • The percentage of scores with values (equal or) lower than the score in question. • Where x from PRx is a score (value) • Looking for a percentage
Table 3.7 (p. 46) Relative frequency, cumulative frequency, and cumulative percentage distributions… Note. The Relative fs were removed from this table since they are not required to calculate percentiles and/or percentile ranks. Determine (compute) the 50th Percentile (P50) for the statistics exam scores.
Table 3.7 (p. 46) Relative frequency, cumulative frequency, and cumulative percentage distributions… Note. The Relative fs were removed from this table since they are not required to calculate percentiles and/or percentile ranks. Determine (compute) the 20th Percentile (P20) for the statistics exam scores.
Table 3.7 (p. 46) Relative frequency, cumulative frequency, and cumulative percentage distributions… Note. The Relative fs were removed from this table since they are not required to calculate percentiles and/or percentile ranks. Determine (compute) the 75th Percentile (P75) for the statistics exam scores.
Table 3.7 (p. 46) Relative frequency, cumulative frequency, and cumulative percentage distributions… Note. The Relative fs were removed from this table since they are not required to calculate percentiles and/or percentile ranks. Determine (compute) the percentile rank (PR) for a score of 86.
Table 3.7 (p. 46) Relative frequency, cumulative frequency, and cumulative percentage distributions… Note. The Relative fs were removed from this table since they are not required to calculate percentiles and/or percentile ranks. Determine (compute) the percentile rank (PR) for a score of 59.
Graphing Data Constructing a Graph
Frequency distributions of nominal or ordinal (categorical) data are customarily plotted using the bar graph.
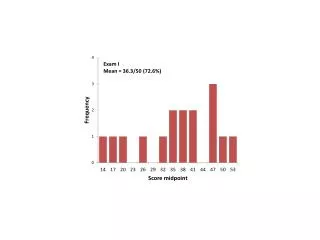
Frequency distributions of interval or ratio (continuous) data are customarily plotted using the histogram.
Given the following set of scores, determine the stem and leaf for the 30s: 10 31 25 35 30 39 45 36 36 68 39 32