Download
1 / 35
370 likes | 530 Vues
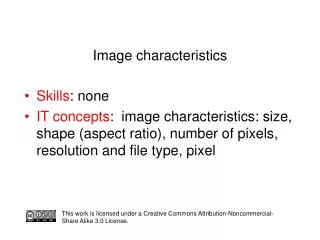
The quality of image data is primarily determined by the characteristics of sensor-platform system. The image characteristics are usually referred to as: 1. Spatial characteristics: Refer to the area measured

E N D
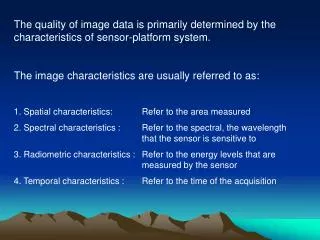
The quality of image data is primarily determined by the characteristics of sensor-platform system. The image characteristics are usually referred to as: 1. Spatial characteristics: Refer to the area measured 2. Spectral characteristics : Refer to the spectral, the wavelength that the sensor is sensitive to 3. Radiometric characteristics : Refer to the energy levels that are measured by the sensor 4. Temporal characteristics : Refer to the time of the acquisition
These characteristics can be further specified by the: Extremes that are observed (coverage) and The smallest unit that can be distinguished (resolution) Spatial Coverage: It refers to the total area covered by one image. In case of multispectral scanners this is proportional to the total field of view (FOV) of the instrument, which determines the swath width on the ground. Spatial Resolution: It refers to the smallest unit-area measured. This indicates the minimum details of objects that can be distinguished.
Spectral Coverage: Total wavelength range observed by the sensor Spectral resolution: Relates to the width of the spectral wavelength bands that the sensor is sensitive to. Dynamic range: The minimum and maximum energy levels that can be measured by the sensor. Radiometric resolution: The smallest differences in levels of energy that can be distinguished by the sensor. Temporal Coverage: Span of time over which images are recorded and stored in image archives. Revisit Time: minimum time between two successive image acquisition over the same location on earth. This is sometimes also referred to as Temporal resolution
R E S O L U T I O N
Types of Resolution Spatial Spectral Radiometric Temporal
Spatial Resolution The dimension of a single pixel The extent of the smallest object on the ground that can be distinguished in the imagery Determined by the Instantaneous Field of View of satellite instruments (IFOV) Determined by altitude and film characteristics for air photos.
IFOV 1 pixel
Raster grid size finer Coarser
Available Resolution Satellites: ~ .61 m to > 1 km Air photos ~ <0.6 m to large.
Satellite Data Resolution MODIS: 250 - 1000 m Landsat MSS: 80 m Landsat TM5, 7: 28.5 m IRS MS: 22.5 m SPOT: 20 m ASTER: 15m IRS Pan: 5 m Quickbird Pan: 0.6 m pan
Quickbird (Digital Globe, Inc.) ~ 2.4 m spatial resolution in multispectral bands.
MODIS 500 m spatial resolution
Spectral Resolution How finely an instrument “divides up” the range of wavelengths in the electromagnetic spectrum How many spectral “bands” an instrument records
Spectral Resolution Related to the measured range of EMR Wide range - coarse resolution Narrow range - finer resolution
Case 1 Measure the EMR across a wide range E.g., the visible portion of EMR Assign a single DN for sum of all visible light energy hitting the sensor Analogous to black and white (panchromatic) film
Case 1 green blue red UV Near-infrared 0.4 0.5 0.6 0.7
Case 2 Measure EMR across narrower ranges E.g., Blue, green and red bands Assign a DN for each of these wavelength ranges to create 3 bands
Case 2 green blue red UV Near-infrared 0.4 0.5 0.6 0.7
Coarser (lower) Spectral Resolution Red Green Blue RGB Finer (higher) Spectral Resolution
High Spectral Resolution Reflectance Wavelength (nm) Low Spectral Resolution Reflectance Wavelength (nm)
Radiometric Resolution How finely does the satellite divide up the radiance it receives in each band? Usually expressed as number of bits used to store the maximum radiance 8 bits = 28 = 256 levels (usually 0 to 255)
64 levels (6 bit) 4 levels (2 bit)
Radiometric resolution 1 bit ( 0 - 1) 8 bit ( 0 - 255 ) 16 bit ( 0 - 65,535 ) 32 bit ( 0 - 4,294,967,295 ) & more 0: No EMR or below some minimum value (threshold) 255: Max EMR or above some threshold for 8 bit data type
Radiometric resolution 8 bit data (256 values) Everything will be scaled from 0 – 255 Subtle details may not be represented 16 bit data (65,536 values) Wide range of choices Required storage space will be twice that of 8 bit
Radiometric Resolution 1 bit 2 ( coarse ) 8 bit 256 16 bit 65536 32 bit 4 Billion 64 bit ( detailed )
Calculation of Image Size in Bytes • No. of rows X No. of columns X No. of bands X No. of bits per pixel • Example: • 4-band X 3000 rows X 3000 columns X 1 byte = 36 Mb • Meteosat-8 generates: 3700 X 3700 X 12 bands X 1.25 bites X 96 images per day = 20 Gb/day
Temporal Resolution Time lag between two subsequent data acquisitions for an area Example: Aerial photos in 1971, ’81, ’91 and 2001 The temporal resolution is 10 years
Return Time (Temporal Resolution) How frequently does a satellite view the same place? Depends on: Orbital characteristics Swath width Ability to point the recording instrument
June 2002 April 2002 Jul 2002 Aug 2002 When would you be likely to make a good agriculture map?
TEMPORAL DATA FOR MONITORING CROP DYNAMICS WHEAT Jan 01, 1999 Nov 11, 1998 Dec 08, 1998 Feb 18, 1999 Mar 14, 1999 MUSTARD Y I E L D Yield = f(NDVI) NDVI PROFILE Wheat CROP GROWTH AND YIELD MODELING NDVI = f(LAI) NDVI N D V I Mustard LAI
IRS – LISS-I 76 meters IRS – LISS-II 36 meters IRS – LISS-III 23 meters IRS – WIFS 188 meters IMPROVEMENTS IN SPATIAL AND SPECTRAL RESOLUTIONS OF IRS SENSORS IRS – OCM 360 meters IRS – PAN 5 meters TES – PAN 1 meter