Download

1 / 44
440 likes | 675 Vues
Experimental Designs: True, Quasi, Pre. HDFS 8200: Research Methods in HDFS (MANFRA) Fall 2011. Recall:. IV => Independent variable DV => Dependent variable The IV influences the DV Discrete vs. Continuous variables Active vs. Attribute IV External validity Sampling Random selection.

E N D
Experimental Designs:True, Quasi, Pre HDFS 8200: Research Methods in HDFS (MANFRA) Fall 2011
Recall: • IV => Independent variable • DV => Dependent variable • The IV influences the DV • Discrete vs. Continuous variables • Active vs. Attribute IV • External validity • Sampling • Random selection
Example • Research is interested in the effects of parental separation on adolescent academic motivation • Participants of interest: adolescents • Constructs of interest: • Parental separation • Academic motivation • Variables (operational definition): • Separation (IV, Attribute): One parent moves out of adolescent’s primary residence for a reason related to marital disharmony (trial separation, pre-divorce, divorce, etc.) • Academic motivation (DV): Adolescent’s self-report of the importance and desire to do well (in terms of grades) in school and continue his/her education post-graduation
Example • Research question: Does the separation of an adolescent’s parents affect his/her motivation to do well academically in school and pursue education after graduating High School? • Hypothesis: Adolescents whose parents separated within 2 years will have lower self-reported motivation to get good grades in High School and will also have lower self-reported motivation to attend college compared to adolescents whose parents are not separated. • NOTE: “separated” implies a current state of the sample not what is about to or may come in the future; clear comparison of two groups on two DVs (motivation for grades and college); limitation of separation event to the past 2 years
Example • Measures: • Adolescent report of whether one parent has moved out of their primary residence within last 2 years (Discrete, Dichotomous) • Adolescent report of importance and desire for good classroom grades (Continuous, Based on multiple Likert scale questions) • Adolescent report of importance and desire for going to college (Continuous, Based on multiple Likert scale questions) • NOTE: “importance and desire” is operational definition of motivation • Sample: volunteers from 2 local high schools • Parents provide consent; adolescent provides written assent • Adolescent fills out anonymous questionnaire and returns it to the researcher via mail • Adolescents who live with only one parent and the other parent did not move out within 2 years are excluded from the study
Design Characteristics • The following study design characteristics will determine the type of study design along with the type (attribute, active) of IV (e.g., true experiment, quasi-experiment) • Research does not always have the option (nature of study topic and ethics determines choice) or some options contain too much cost • Making the decision to go with one over the other will result in a give-and-take between internal validity and external validity • One-group vs. Multi-group • Equivalent vs. Nonequivalent • Randomized vs. Nonrandomized • Matched vs. Nonmatched • Posttest-only vs. Pretest-posttest vs. Time series • Temporary treatment vs. Continuous treatment
One-group vs. Multi-group • One-group => everyone in sample experiences the IV event • Multi-group => sample is divided into 2 or more groups • Typically 2 groups: • 1 group experiences IV event (level 1) • 1 group does not (level 2) • Allows experimenter to compare outcome (DV) at different levels of IV (event, no event) • If groups do not differ on DV, no support for hypothesis
One-group vs. Multi-group One-group E DV Pre-Event Post-Event IV Multi-group E DV C Pre-Event Post-Event IV
One-group vs. Multi-group • The more groups in the study, the more confidence that the research has that the IV-event is causingor influencing the DV • Internal validity => the extent to which one can infer that the IV caused the DV • With only 1 group, it is nearly impossible for the researcher to distinguish between the effects of time or practice from the effects of the IV • Control or comparison groups are used to remove the ambiguity from the study
One-group vs. Multi-group • Example: A research is interested in knowing if copying numerals in order will increase preschool children’s numeric knowledge. • One-group design: • All children are assessed on numeric knowledge (Pretest); then, copy numerals for 10 minutes a day for two weeks; then, all children are assessed on numeric knowledge (Posttest) • Children increase from pre to post on numeric knowledge. Aside from the activity, why might this have happened?
One-group vs. Multi-group • Example: A research is interested in knowing if copying numerals in order will increase preschool children’s numeric knowledge. • Two-group design: • All children are assessed on numeric knowledge (Pretest); then, half the children copy numerals for 10 minutes a day for two weeks (E) and half copy letters for 10 min/day for 2 weeks (C); then, all children are assessed on numeric knowledge (Posttest) • All children increase from pre to post on numeric knowledge. Clearly, it is not the copying of numerals that increases numeric knowledge. So, why did all of the children increase in numeric knowledge?
One-group vs. Multi-group • Example: A research is interested in knowing if copying numerals in order will increase preschool children’s numeric knowledge. • Four-group design: • All children are assessed on numeric knowledge (Pretest) • Then: • Quarter the children copy numerals for 10 min/day for two weeks (E) • Quarter copy letters for 10 min/day for 2 weeks (C1) • Quarter color for 10 min/day for 2 weeks (C2) • Quarter do not do any added activity for 2 weeks (Control) • Then, all children are assessed on numeric knowledge (Posttest) • Children copying letters increase from pre to post on numeric knowledge. Children coloring increases very slightly. Children with no added activity show no increase in numeric knowledge. • How confident will the research be in the results (internal validity)? • Why did the children copying numerals and letters increase in numeric knowledge?
Equivalent vs. Nonequivalent • In multi-group designs, are the groups functionally similar (equivalent) or different (nonequivalent) • How does the research make two groups equivalent? • Random assignment to groups • When participants are not randomly assigned to groups, the groups are considered nonequivalent • Typically happens with existing groups (e.g., classroom) • Randomized vs. Nonrandomized • Randomized = equivalent • Nonrandomized = nonequivalent • FYI: most study designs are worded as Randomized vs. Nonequivalentprimarily because the word “equivalent” has too strong of an implication and nonequivalent groups can have some randomization
Randomized vs. Nonequivalent • Why is randomization important? • If participants are randomly assigned to groups, the researcher can be far more confident that the outcome of the study is related to the variable of interest (IV) rather than another (unmeasured) factor that resulted in the nonequivalent groups • Randomization dramatically increases internal validity • Separation Example: what other (unmeasured) factor might have a negative effect on adolescents’ motivation for doing well in school and going to college that also resulted in the separation?
Randomized vs. Nonequivalent • What can change during a study? • It is possible that randomized groups (equivalent) become nonrandomized during the course of the study • For example, attrition or mortality • Systematic attrition – something about the study causes a specific subset of participants to drop out
Matched vs. Nonmatched • Pertains to studies with more than one group • Matched sample => prior to assigning individuals to groups, they are matched by the number of groups on an important factor known to influence the DV • “Guarantees” that each group will have nearly the same statistical mean and variance of the matching factor and thereby have “equivalent” covariation with the DV • Nonmatched sample => participants are simply assigned to a group • With small samples, it is possible to end up with nonequivalent groups even with random assignment • Matching the sample ahead of time will decrease this possibility provided each half of the participants has a close match in the other half
Posttest-only vs. Pretest-posttest vs. Time series • These characteristics have to do with the number of times the DV is measured • NOTE: This is not related to the length or number of implementations of the IV event • Posttest-only => the DV is measure only once and after the IV event • Pretest-posttest => the DV is measure twice—before and after the IV event • Time series => the DV is measure multiple times before and after the IV event • Before the IV event provides baseline data—what is the change that is expected between time points with no IV • After the IV event provides the lasting effect of the IV—did the IV act as an intervention causing lasting change or a curriculum causing temporary change? • Typically, time series have 3 or more time points of data collection before and after (total 6) the IV event • However, it should be noted that more than 1 measure of the DV before (and after) the IV event is better than only 1 (sometimes called multiple-pretest multiple-posttest rather than time series)
Posttest-only vs. Pretest-posttest ? ? Posttest-only ? DV Pretest-Posttest Pre-Event Post-Event IV • Again, the primary consideration here is related to internal validity • Which design option provides the researcher more confidence that the IV caused the DV • With the posttest-only design option, the researcher only knows how the sample measures on the DV after the IV event—there is no way to be 100% confident about how they measured on the DV before the IV event • Sometimes this is all one can do…exploring effects of tornado on family • The pretest-posttest design option provides the researcher with information about the DV before and after the IV event
Pretest-posttest vs. Time series IV event Time Series DV Pretest-Posttest Pre-Event Post-Event IV • With the time series design, the research is more confident that the “natural” progression (increase) of the DV between time points is nearly null (0) • Therefore, the increase in slope from before to after the IV event is more likely caused by the IV event itself and not “natural growth” • What is another possible reason for the growth after the IV event? • The pretest-posttest design does not provide the researcher with information about the “natural” change of the DV. • It is possible that the “natural growth” of the DV is all the researchers sees—in other words, the IV event has no effect. With a pretest-posttest design, it might be erroneously concluded that the IV caused the DV when it did not.
Temporary treatment vs. Continuous treatment • Temporary treatment => IV event occurs during an isolated time point or time interval—there is no measure of the DV during this time • It is possible for another unmeasured or unknown factor that occurs concomitantly with the IV to cause the change in the DV (e.g., having outside researchers in a childcare center causes teachers to “do more” with children—the researchers program actually has no impact) • Continuous treatment => IV event occurs on a regular basis and measures of the DV occur within the time frame of IV event implementation • The continuous treatment option can limit the researchers ability to explore lasting effects of an intervention—or determine whether a program is an intervention (changes the trajectory after event) or a curriculum (changes the trajectory during event) • Intermittent treatment => IV event occurs during a time period, then stops for an equivalent time period, then starts again, etc. • Provides evidence that a “fluke” didn’t result in the change in DV if the change occurs after every “IV event start” interval
Temporary vs. Intermittent Treatment IV event DV IV event IV event DV
Summary • “Best” design? • Theoretically: a matched, randomized, multi-group time series design with intermittent treatment! • Practically: it depends on the question, the situation, the environment, the participants, etc. The goal is to increase the internal validity of the study as much as possible within the confounds and constraints raised by the topic • NOTE: in your book (like most texts), true experimental designs often do not collect DV data at multiple time points. This is mostly because it is deemed unnecessary with a randomized sample—there is little threat to internal validity when studies have high control of an active IV and the participants are randomly sampled and randomly assigned to groups
Choosing a Research Design • Best addresses the problem • Ethics • Cost in time and money • Validity (internal & external)
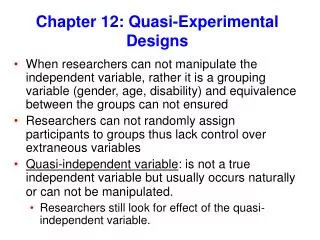
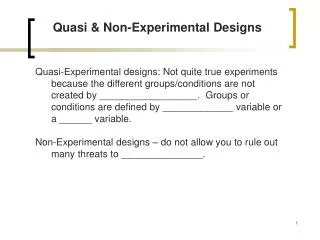
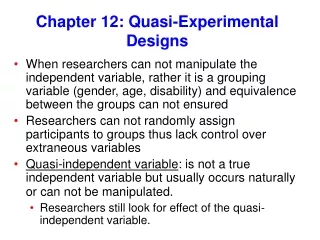
Quasi-Experimental Designs • By definition what do we have to rule out? • One-group vs. Multi-group • Equivalent vs. Nonequivalent • Randomized vs. Nonrandomized • Matched vs. Nonmatched • Posttest-only vs. Pretest-posttest vs. Time series • Temporary treatment vs. Continuous treatment
Quasi-experimental Designs • One group posttest-only design • One group pretest-posttest design • Non-equivalent control group design • Non-equivalent control group pretest-posttest design • Time series
Experimental Design • Advantages • Best establishes cause-and-effect relationships • Disadvantages • Artificiality of experiments • Feasibility • Unethical
Causality • Temporal precedence • Covariation between IV and DV • Eliminate alternative explanations
Types of Experimental Designs • Simple True Experimental • Complex True Experimental • Quasi-Experimental
Characteristics of True Designs • Manipulation (treatment) • Randomization • Control group Characteristics of simple true designs • One IV with 2 levels (T, C) • One DV
Types • Randomized posttest control group design • Randomized pretest-posttest control group design R T Post R C Post R Pre T Post R Pre C Post
Advantages & Disadvantages • Advantages of pretest design • Equivalency of groups • Can measure extent of change • Determine inclusion • Assess reasons for and effects of mortality • Disadvantages of pretest design • Time-consuming • Sensitization to pre-test
Solomon four-group design R Pre T Post R Pre C Post R T Post R C Post • Can measure if the PRE assessment has an affect on POST by comparing the POST scores of the first two groups to the POST scores of last two groups. • If they are respectively similar, then the PRE scores did not impact the POST scores. • If the are respectively different, then the PRE scores did impact the POST scores.
Complex True Experimental • Randomized matched control group design • Increased levels of IV • Factorial design • Multiple DVs
Randomized matched control group design M R T Post M R C Post • Used in small samples • cost in time & money
Increased Levels of IV • Provides more complete information about the relationship between the IV & DV • Detects curvilinear relationships • Examines effects of multiple treatments
DV Performance level (% complete) IV Amount of reward promised ($)
Increased Levels of IV DV Performance level (% complete) IV Amount of reward promised ($)
Factorial Design • >1 IV (factor) • Simultaneously determine effects of 2 or more factors on the DV (real world) • Between Factor vs. Within Factor • Described by # of factors and levels of factors • E.g., 2 x 3 Between Subjects Factorial Design
Do different exercise regimens (hi, med, lo intensity) have the same effect on men as they do on women? • 3 X 2 (Exercise Regimen X Gender) • 2 factors • Exercise Regimen – 3 levels • Gender – 2 levels • Between factors • DV? • Active or attribute IVs?
Do strength gains occur at the same rate in men as they do in women over a 6 mo. training period? Measurements are taken at 0, 2, 4, 6 mo. • 2 X 4 (Gender X Time) • ? factors • Time – 4 levels • Gender – 2 levels • Between or within factors? • DV? • Active or attribute IVs?